|
The Debasement Trade
|
|
The Treasury’s buyback program invoked bad memories of quantitative easing (QE), the Federal Reserve’s program to create money in order to purchase Treasury securities.
|
|
QE increased the money supply, and investors questioned whether the Fed was simply printing money to cover government deficits.
|
|
This time, the Treasury’s move isn’t exactly QE. The buyback program is designed to issue short-term debt to buy back long-term debt, which means no net change in the money supply.
|
|
But that hasn’t stopped fears of currency debasement.
|
|
Currency debasement means a currency loses value – usually because the government expands the money supply.
|
|
While Treasury yields didn’t respond much to the announcement, the real impact was felt in the U.S. dollar and assets sensitive to its movements. Scarce assets tend to perform well when debasement fears are on the rise and the U.S. dollar is weakening.
|
|
Traditionally, precious metals were the primary beneficiaries of debasement fears. But in modern times, Bitcoin has emerged as the digital equivalent.
|
|
Bitcoin jumped following the announcement, and the chart tipped a rebound was in store. Now evidence is emerging that Bitcoin’s rally could be prone to a reversal.
|
Tune in to Trading With Larry Live 
Each week, Market Wizard Larry Benedict goes live to share his thoughts on what’s impacting the markets. Whether you’re a novice or expert trader, you won’t want to miss Larry’s insights and analysis. Even better, it’s free to watch. Visit us on YouTube to catch the latest! |
|
|
Bitcoin Rally Losing Steam
|
|
Fears over currency debasement are delivering a boost to Bitcoin. But it was no surprise that a rally unfolded when it did.
|
|
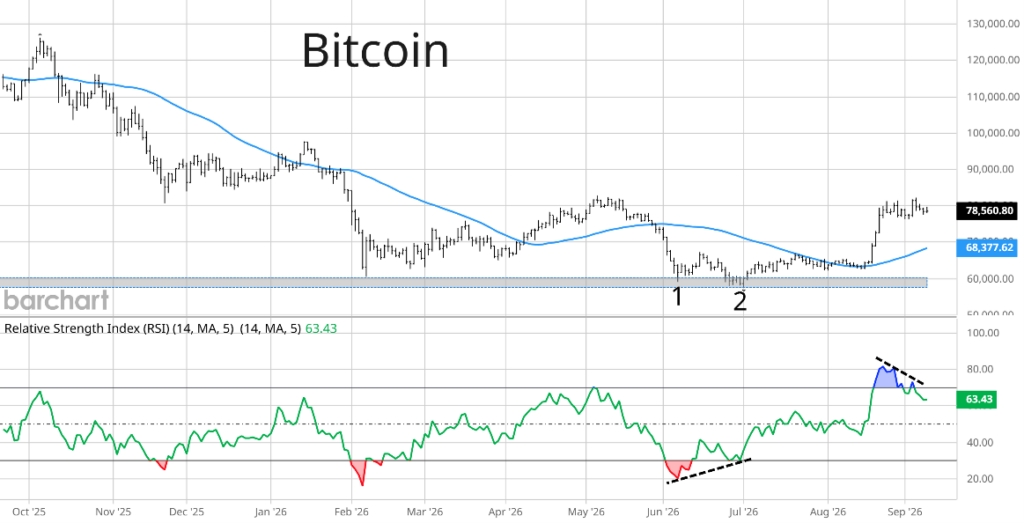
The Bitcoin price area around $60,000 has been tested multiple times this year. It is also a key congestion zone tested numerous times in 2024. That makes $60,000 an important “make-or-break” level.
|
|
While Bitcoin was testing support, a positive momentum divergence formed. Take a look at the chart:
|
|
|
|
The shaded area shows the $60,000 support level. At the start of June, Bitcoin started testing support at “1.” A second test at “2” produced a lower low in price. But a positive divergence on the Relative Strength Index (RSI) showed downside momentum was fading.
|
|
That helped spark a rally, which picked up steam as Bitcoin surged above the 50-day moving average (MA – blue line) following the Treasury’s buyback announcement.
|
|
But the current move has left Bitcoin extended far above the 50-day MA. Meanwhile, a negative divergence is now forming in the RSI. That means Bitcoin is showing signs of a reversal lower.
|
|
Bond market intervention and QE fears will spark renewed volatility in Bitcoin. That means this is an asset to keep an eye on in the coming weeks.
|
|
For right now, the evidence suggests that Bitcoin’s rally has gone too far.
|
|
Happy Trading,
|
|
Larry Benedict
Editor, Trading With Larry Benedict
|
|
|
Get Instant Trade Alerts on Mobile!
|
|
|
|
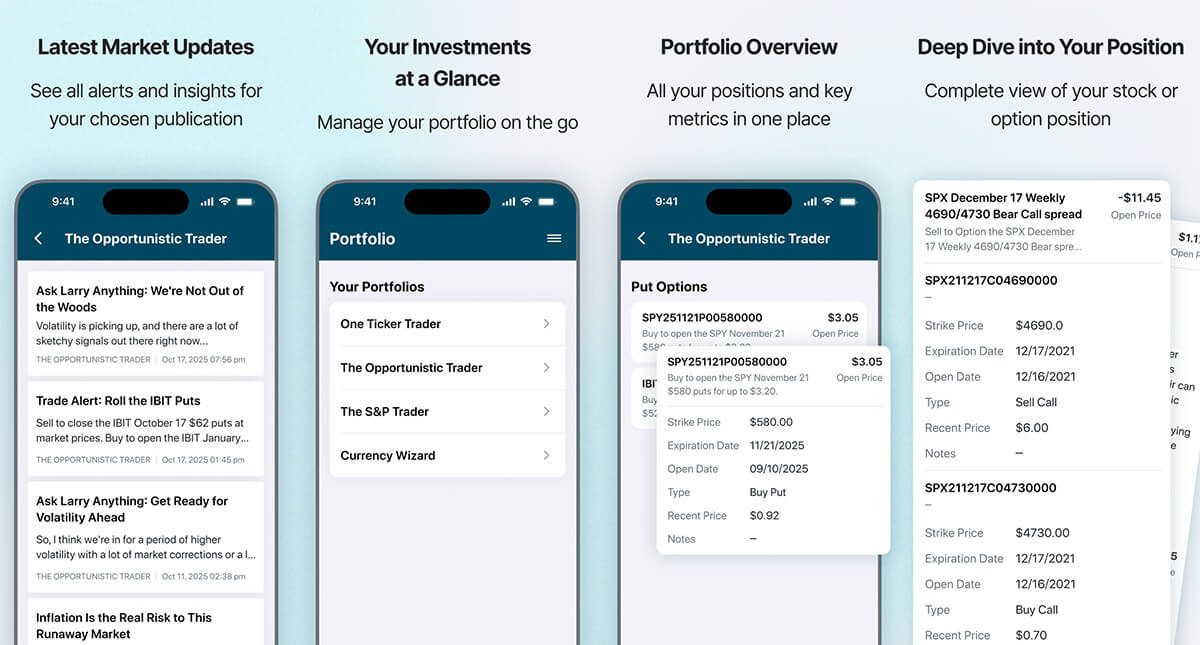
Click the icon below from your mobile device to download The Opportunistic Trader app today for one-tap access to trade alerts, issues, and model portfolios for all of Larry’s services.
|
|
Available in the app store on Android and iPhone.
|
|
|
|














No comments:
Post a Comment