|
What the VIX Doesn’t Tell You
|
|
One common misconception is that the VIX measures volatility across the entire stock market. After all, it’s derived from the S&P 500, which accounts for around 80% of the total market capitalization of publicly traded U.S. stocks.
|
|
However, the VIX measures the expected volatility of the S&P 500 itself. And that’s an important distinction.
|
|
As we’ve seen in earnings, if one large technology stock jumps sharply (say, 10%) while another falls heavily (e.g., 12%), their impact on the index can partially offset each other. Combined, the index might move just a fraction of one percent.
|
|
In response, the VIX would remain relatively subdued. Yet beneath the surface, there’s clearly plenty going on.
|
|
Higher Treasury yields are forcing investors to reassess valuations. This especially applies to stocks priced for strong growth. The AI investment story is also being tested. Investors want to see hard evidence that big spending is turning into larger profits (not just revenue growth).
|
|
In short, investors want proof that today’s valuations can be justified.
|
|
The result, as we’ve seen this earnings season, is a much bigger gap between winners and losers. In the meantime, investors continue to grapple with an increasingly uncertain macroeconomic backdrop.
|
|
Geopolitical tensions – particularly in the Middle East – continue to influence expectations for oil prices, inflation, and interest rates. Each economic release also carries greater significance due to the Federal Reserve stepping back from providing commentary and economic projections.
|
|
These factors don’t necessarily create large moves in the index each day. But they can create large moves in individual stocks.
|
|
That’s why we’re seeing such a disparity in the day-to-day action versus what the VIX suggests.
|
Tune in to Trading With Larry Live 
Each week, Market Wizard Larry Benedict goes live to share his thoughts on what’s impacting the markets. Whether you’re a novice or expert trader, you won’t want to miss Larry’s insights and analysis. Even better, it’s free to watch. Visit us on YouTube to catch the latest! |
|
|
Why Volatility Traders Are Thriving Right Now
|
|
“Buy and hold” investors can find this type of market really frustrating, especially after the last few years of such a strong underlying (up)trend.
|
|
However, for traders it’s the exact opposite. The best trading opportunities rarely emerge when everything is moving in the same direction. They appear when investors become overly optimistic, excessively pessimistic, or too reactive to each new piece of information.
|
|
Stocks start heading in all directions. That’s where dislocations occur and where we can really get to work.
|
|
When some of the world’s biggest companies are moving 10%, 12%, or even 14% in a single trading session, there will be plenty of trading opportunities around no matter what the VIX is saying.
|
When markets overreact, I can put my mean reversion strategy into action. That’s where I look for stocks that have become overstretched and aim to profit when they snap back the other way.
|
|
One of the biggest mistakes traders can make is assuming that volatility only occurs when the VIX spikes.
|
|
In reality, some of the best opportunities emerge when index volatility (VIX) remains relatively subdued yet individual stocks are experiencing significant price swings.
|
|
And the good news for us is that’s the exact type of market we’ve entered.
|
|
Happy Trading,
|
|
Larry Benedict
Editor, Trading With Larry Benedict
|
|
|
Get Instant Trade Alerts on Mobile!
|
|
|
|
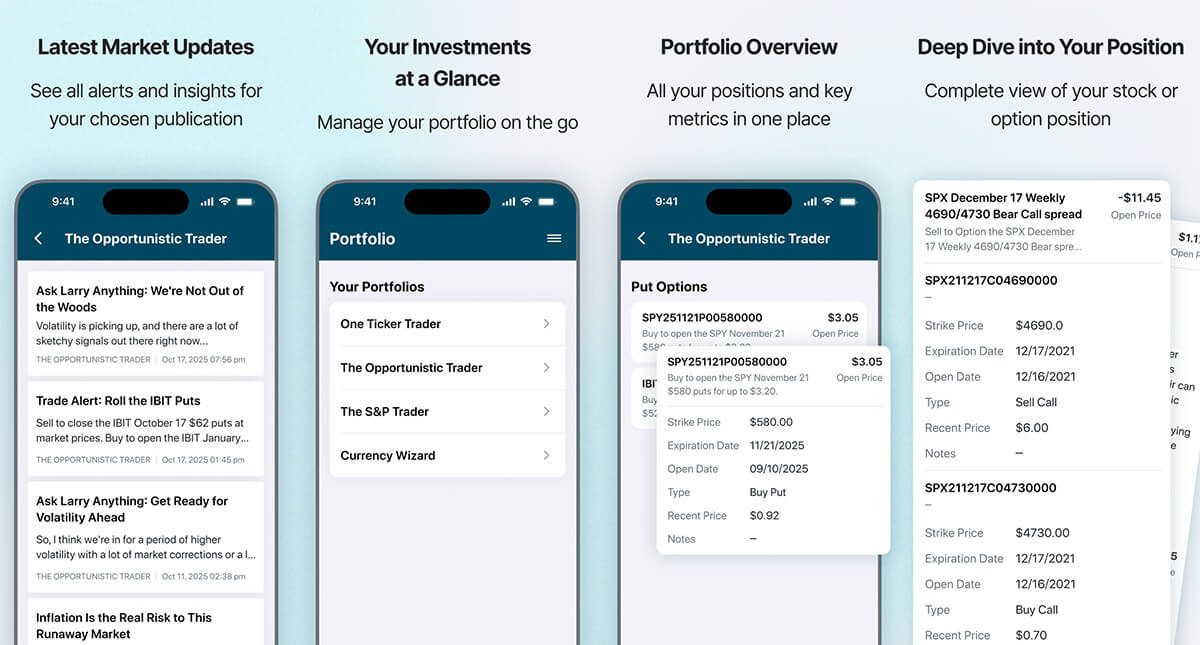
Click the icon below from your mobile device to download The Opportunistic Trader app today for one-tap access to trade alerts, issues, and model portfolios for all of Larry’s services.
|
|
Available in the app store on Android and iPhone.
|
|
|
|












No comments:
Post a Comment