|
Mean Reversion in Action
|
|
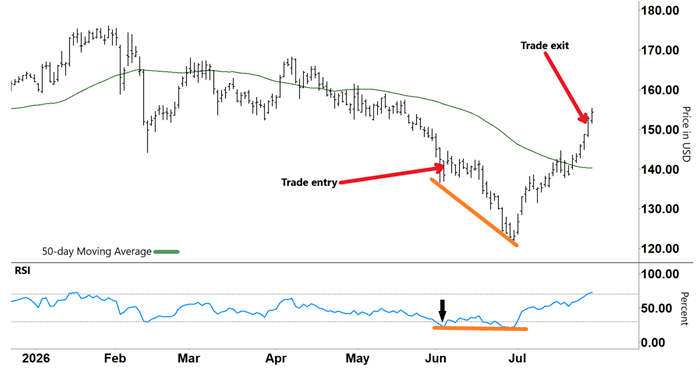
On the chart below, the 50-day moving average (MA, green line) shows ICE’s prevailing downtrend. That down move began in August 2025 after ICE peaked at its all-time high (around $189).
|
|
From its January peak to early June, ICE lost 22%. It had also pushed the Relative Strength Index (RSI), a momentum indicator, into oversold territory (black arrow).
|
|
Check out the chart…
|
|
Intercontinental Exchange (ICE)
|
|
|
|
Source: e-Signal
|
|
One of my favorite mean reversion signals occurs when the RSI forms a “V” out of oversold territory. That tells me selling momentum is beginning to exhaust itself and buyers are starting to regain control.
|
|
To capture that up move, we can use a call option. A call option typically increases in price when the underlying stock rallies. Options also mean our risk is clearly defined.
|
|
When you buy an option, the most you can lose is the premium you paid. In this case it was $2.73 (or $273) per option contract – one option contract is for 100 shares.
|
|
As you can see, after a promising start, the move in ICE soon stalled. Then, around the middle of June, ICE broke lower. It would have been frustrating if we had just bought shares instead.
|
|
By the time ICE bottomed out around the $122 level, we would have been down around $16 from where ICE was trading when we entered the trade. That equates to around $1,600 for 100 shares (the same number as one option contract).
|
|
Again, that’s why we use options – our risk is clearly defined ($273 in contrast). Plus, the call option gives us exposure to the upside.
|
Tune in to Trading With Larry Live 
Each week, Market Wizard Larry Benedict goes live to share his thoughts on what’s impacting the markets. Whether you’re a novice or expert trader, you won’t want to miss Larry’s insights and analysis. Even better, it’s free to watch. Visit us on YouTube to catch the latest! |
|
|
Deciding to Hold the Trade
|
|
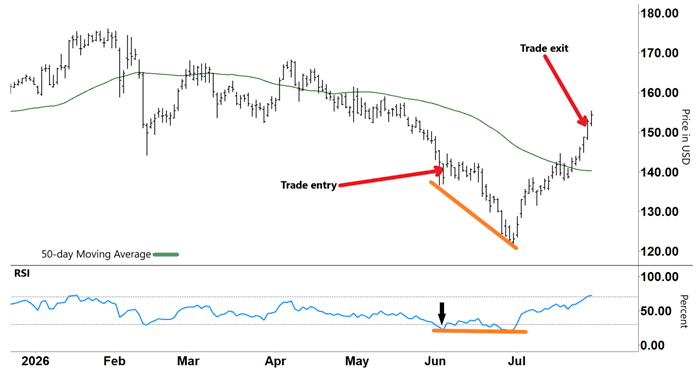
There was another reason we held on to the trade too. The RSI and the stock price were forming a converging pattern (orange lines). That’s often a bullish signal that selling pressure is abating. When the RSI rebounded again from oversold territory, this time sellers were exhausted. Rising buyer momentum saw ICE sharply reverse and begin to rally.
|
|
Again, check out the chart…
|
|
Intercontinental Exchange (ICE)
|
|
|
|
Source: e-Signal
|
|
After breaking through the 50-day MA – often a resistance level in a downtrend – ICE consolidated before bullishly breaking higher, pushing our trade into good profit.
|
|
The RSI pierced overbought territory (upper gray dashed line), putting ICE in danger of a reversal. We didn’t want to risk giving back those gains, so we exited the position on July 28 at $4.20, or $420 per contract – a tidy 54.1% gain.
|
|
Had we simply bought the shares, we would have likely been stopped out for a significant loss. Again, it highlights the versatility of using options. We can give a trade enough room to move while always knowing our maximum loss.
|
|
To be clear, because options use leverage, they magnify both profits and losses. And because options expire, timing matters.
|
|
However, when the setup is right, they allow us to strictly control risk while shooting for outsized gains – just like we did with this trade.
|
|
Happy Trading,
|
|
Larry Benedict
|
|
|
Get Instant Trade Alerts on Mobile!
|
|
|
|
Click the icon below from your mobile device to download The Opportunistic Trader app today for one-tap access to trade alerts, issues, and model portfolios for all of Larry’s services.
|
|
Available in the app store on Android and iPhone.
|
|
|
|














No comments:
Post a Comment