|
What Is Stock Market Seasonality?
|
Seasonality refers to the stock market’s tendency to rise or fall over certain parts of the calendar year. For example, you’ve probably heard the phrase, “Sell in May and go away.”
|
|
That refers to the S&P 500’s historical tendency to have a difficult six-month stretch from May through October.
|
|
On the other side, the six months from November to April are often bullish when you look back historically.
|
|
That’s a big-picture way of using seasonality. Yet traders can narrow their focus to track seasonality over specific months or other shorter-term trends as well.
|
|
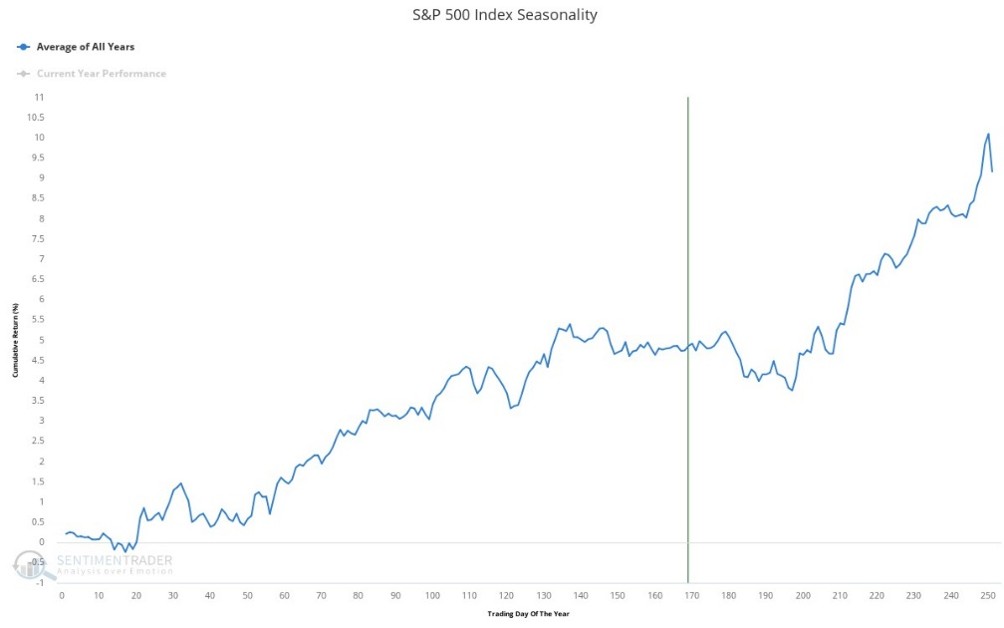
The chart below shows how the S&P 500 has performed on average throughout the year for the past 20 years. The vertical line shows where we are today.
|
|
|
|
Notice that seasonal tendencies also unfold over shorter time frames.
|
|
Following a strong start to August, the S&P 500 has been drifting slightly lower, which is in line with seasonal trends. But don’t expect the rangebound, low-volatility environment to last long.
|
|
That’s because weak seasonality is arriving right on cue – with an extra element of uncertainty over the coming months…
|
Tune in to Trading With Larry Live 
Each week, Market Wizard Larry Benedict goes live to share his thoughts on what’s impacting the markets. Whether you’re a novice or expert trader, you won’t want to miss Larry’s insights and analysis. Even better, it’s free to watch. Visit us on YouTube to catch the latest! |
|
|
Why September Is the S&P 500’s Worst Month
|
|
The month of September is hands-down the worst month of the year for the S&P 500 on average. And it isn’t even close.
|
|
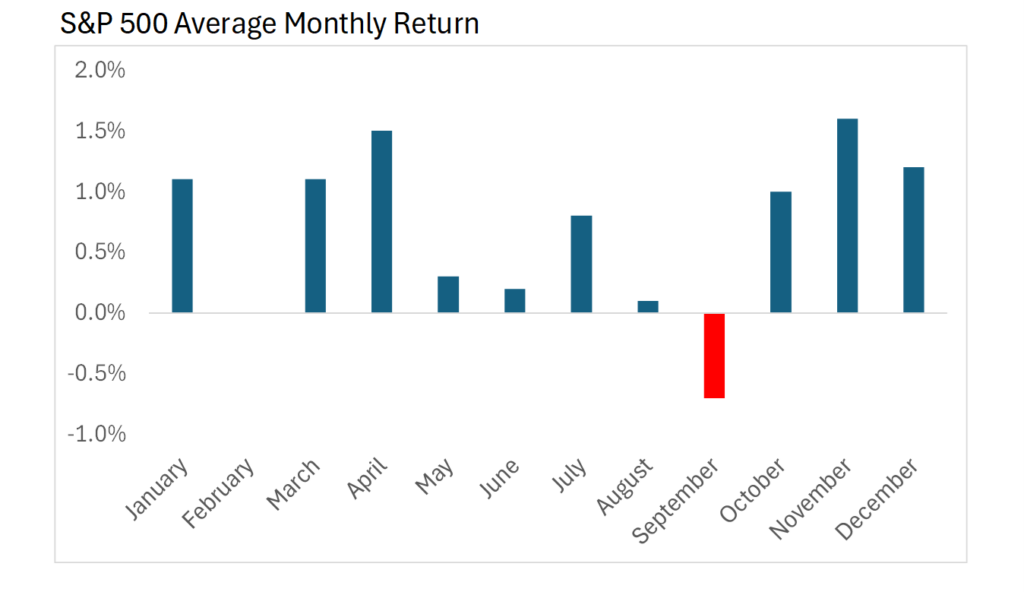
The chart below shows average returns by month for the S&P 500 going back 60 years:
|
|
|
|
Historically, September has delivered an average return of -0.70% for the month. That’s the worst average return and the only negative month.
|
|
It also has the worst “hit rate.” That refers to the percentage of time that the S&P 500 generates a positive return for the month, which stands at just 46% for September.
|
|
And here’s another thing to note about September. When you string together weekly returns during the year, the last two weeks of September are the worst stretch historically.
|
|
Not only that, but the coming midterms this year add another complicating factor, as seasonal weakness is also common heading into elections.
|
|
So while interest rates may play a role in the recent downside in the S&P 500, it’s certainly not the only factor to consider.
|
|
And if the S&P 500 keeps reflecting historical trends, then investors should be prepared for more volatility in the coming weeks…
|
|
Happy Trading,
|
|
Larry Benedict
Editor, Trading With Larry Benedict
|
|
|
Get Instant Trade Alerts on Mobile!
|
|
|
|
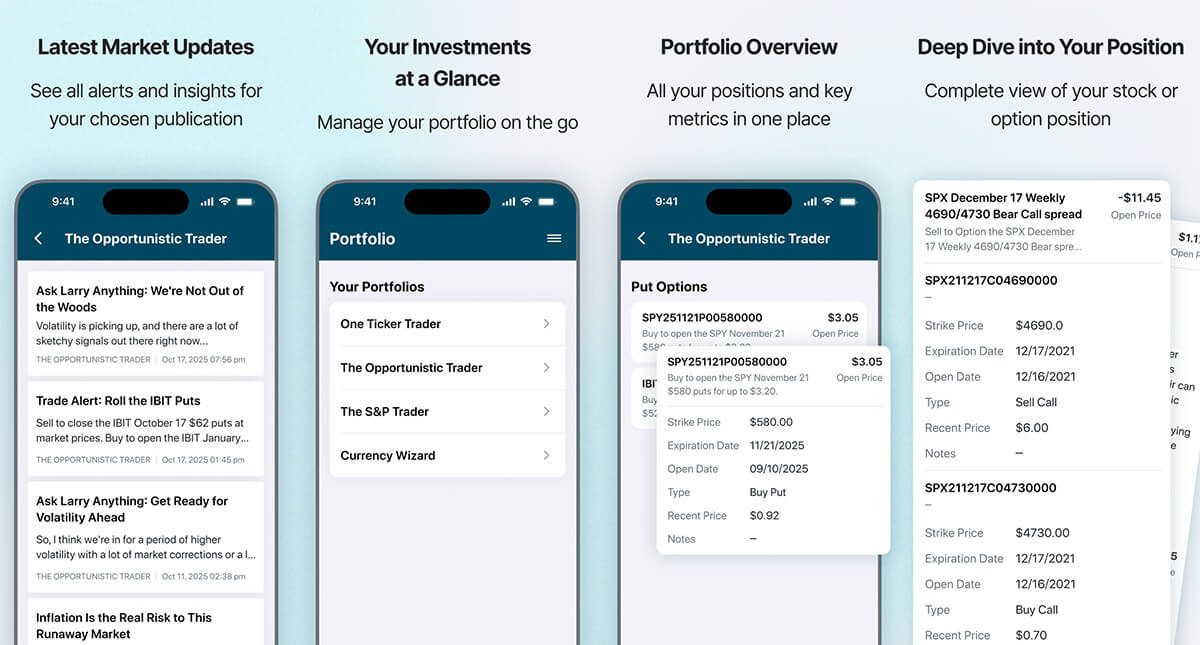
Click the icon below from your mobile device to download The Opportunistic Trader app today for one-tap access to trade alerts, issues, and model portfolios for all of Larry’s services.
|
|
Available in the app store on Android and iPhone.
|
|
|
|














No comments:
Post a Comment