|
The Average Stock Is Extremely Oversold
|
|
Stock market breadth is how you track participation in a trend. You want to see broad participation in a rally.
|
|
But recent evidence points to the exact opposite right now.
|
|
There are lots of ways to track breadth. That could be the number of stocks making new highs versus new lows, advancing securities compared to decliners, or the percent of stocks trading above a key moving average.
|
|
Lately, several metrics point to a worsening pullback in the average stock. For instance, new 52-week lows have outnumbered new 52-week highs across major exchanges every day since late August.
|
|
But growing evidence suggests that the pullback in the average stock has gone too far. That could set up a mean reversion trading opportunity.
|
|
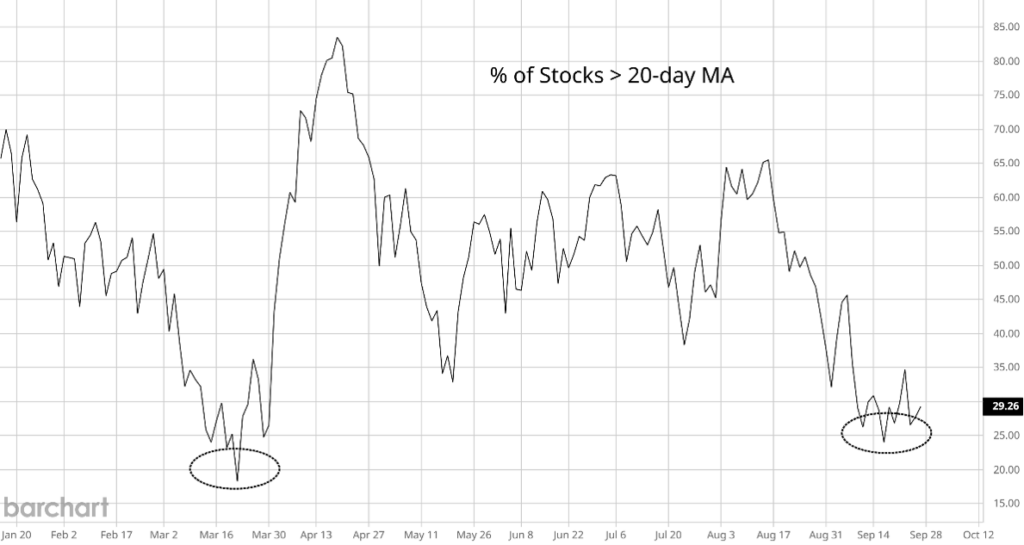
Just look at the percentage of stocks across the market trading above their 20-day moving average (MA). That’s a good way of tracking how many stocks are trading in short-term uptrends. Here’s the chart:
|
|
|
|
The percent of stocks across major exchanges trading above their 20-day MA dropped to 25% recently. Extensions below 30% are rare – this has happened only one other time this year, back in March.
|
|
It marks an extremely oversold condition in the average stock and has often sparked at least a short-term rally in the market.
|
|
That’s one reason it’s time to hunt for mean reversion opportunities in the market’s most beaten-up sectors.
|
Tune in to Trading With Larry Live 
Each week, Market Wizard Larry Benedict goes live to share his thoughts on what’s impacting the markets. Whether you’re a novice or expert trader, you won’t want to miss Larry’s insights and analysis. Even better, it’s free to watch. Visit us on YouTube to catch the latest! |
|
|
Why Financials Are Primed to Rally
|
|
While the Mag 7 are moving to record highs, other sectors are experiencing drawdowns. That includes stocks sensitive to developments in interest rates, such as financials.
|
|
With the Fed hiking short-term rates, that can hurt bank profits. Financials are also sensitive to the outlook for the broader economy, where Fed rate hikes could slow lending activity.
|
|
Financial stocks have been part of the broader pullback that’s gone too far, which is creating an opportunity to play a bounce.
|
|
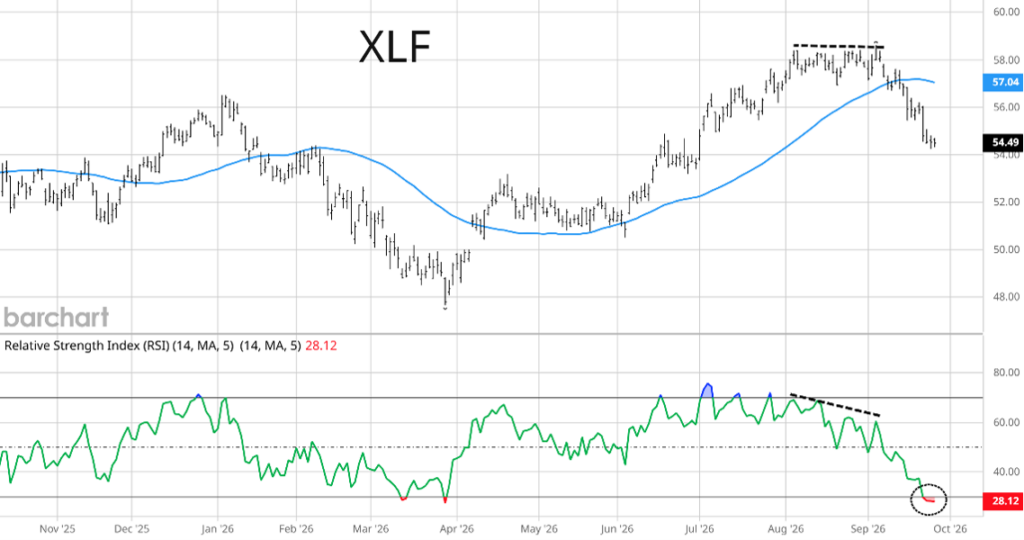
Here’s the chart of the State Street Financial Select Sector SPDR ETF (XLF).
|
|
|
|
A negative momentum divergence hinted at brewing troubles with financials. You can see that when the Relative Strength Index (RSI) made a lower high even as XLF tested the prior highs (dashed lines). That pointed to stalling price momentum.
|
|
A subsequent selloff saw XLF cut through the 50-day MA (blue line). But there are signs that the selloff has gone too far.
|
|
XLF is now extended far below the 50-day. At the same time, the RSI is extending to oversold territory below the 30 level for just the seventh time in three years.
|
|
Those signals say that financials are due for a short-term recovery, at minimum.
|
|
Breadth across the market is hitting extremely low levels, and this is just one opportunity to trade a sector that’s primed to see a snapback rally.
|
|
|
|
Regards,
|
|
Larry Benedict
Editor, Trading With Larry Benedict
|
|
|
Get Instant Trade Alerts on Mobile!
|
|
|
|
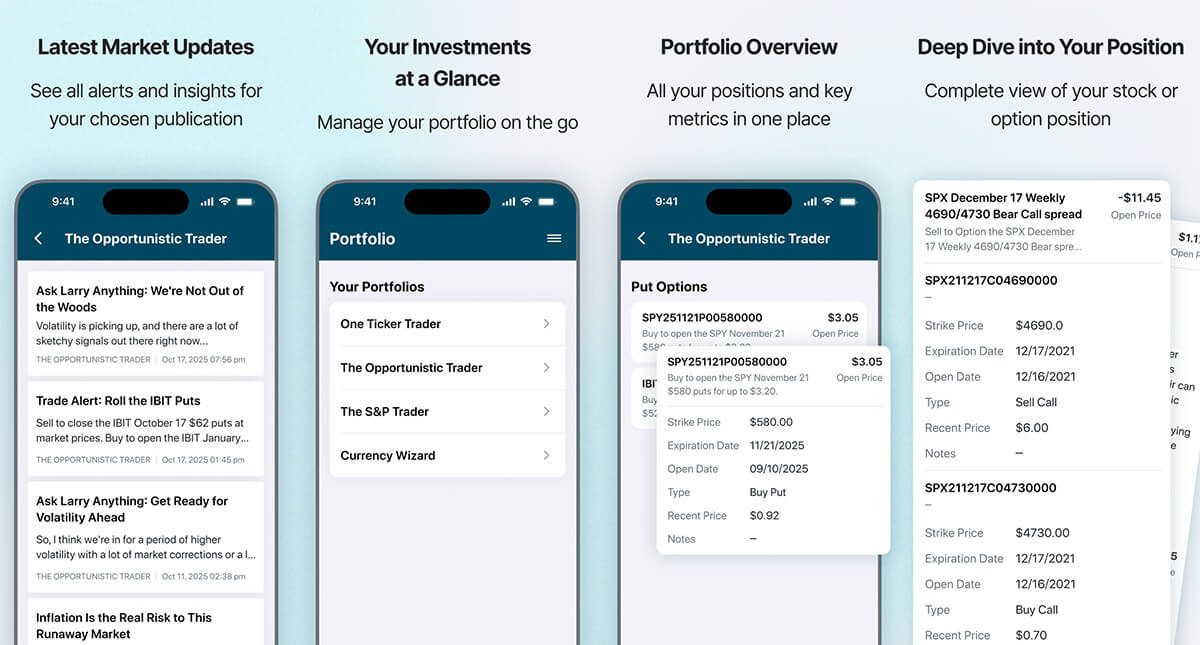
Click the icon below from your mobile device to download The Opportunistic Trader app today for one-tap access to trade alerts, issues, and model portfolios for all of Larry’s services.
|
|
Available in the app store on Android and iPhone.
|
|
|
|

















No comments:
Post a Comment