|
Participation in the Trend
|
|
Breadth is a way of measuring participation in the prevailing trend. In other words, as indexes are breaking out, how many individual stocks within the indexes are moving higher?
|
|
There are a number of ways to measure breadth, such as monitoring how many stocks are making new 52-week highs.
|
|
You can also track the number of advancing stocks relative to declining ones on any given day. Or you can compare the volume in advancers versus decliners.
|
|
We can also look at how many stocks in an index are trading above key moving averages.
|
|
When we’re coming off an exceptionally strong period of short-term returns, I look for the presence of something called “breadth thrusts.” Thrusts are extreme readings in the number of advancing stocks relative to declining ones.
|
|
If we see an abnormally high figure, it indicates very broad and heavy buying pressure – the kind driven by the institutional smart money.
|
|
Those are the investors needed to sustain a longer-term advance.
|
|
And when I look at breadth metrics around this most recent short-term burst, I’m not excited by what I see…
|
Tune in to Trading With Larry Live 
Each week, Market Wizard Larry Benedict goes live to share his thoughts on what’s impacting the markets. Whether you’re a novice or expert trader, you won’t want to miss Larry’s insights and analysis. Even better, it’s free to watch. Visit us on YouTube to catch the latest! |
|
|
Smart Money Isn’t Interested
|
|
One of the simplest ways to monitor for breadth thrusts is to look at a ratio of advancing stocks relative to declining ones (A/D ratio).
|
|
You can do that for just about any index or stock exchange. One popular way is to use the A/D ratio for stocks listed on the NYSE.
|
|
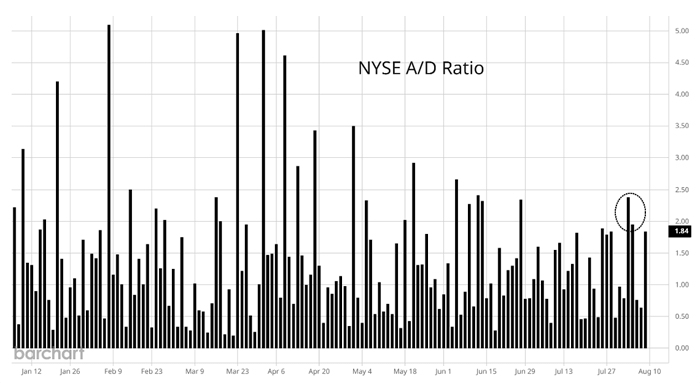
The chart below shows the A/D ratio since the start of the year.
|
|
|
|
During the four days of strong gains, the highest daily reading on the A/D ratio came in at just 2.4 (circle). That means there were a little over two advancing stocks for every declining one on the NYSE.
|
|
That’s an okay figure on any given day but hardly the stuff that sustains an advance over the long term. It’s well off the best readings seen this year, and it lacks the breadth punch seen during similar short-term rallies.
|
|
Coming off the lows in April 2025 (when the tariff-driven selloff was driving markets lower), the A/D ratio registered a reading of 37.2, which was the last time the Nasdaq saw a similar short-term rally.
|
|
Recent breadth metrics tell me that the smart money doesn’t want to own stocks at these levels, and that the large gains were driven by a rally in oversold AI stocks.
|
|
Since the smart money doesn’t seem to be interested in chasing the rally, you should be cautious too.
|
|
Regards,
|
|
Larry Benedict
Editor, Trading With Larry Benedict
|
|
|
Get Instant Trade Alerts on Mobile!
|
|
|
|
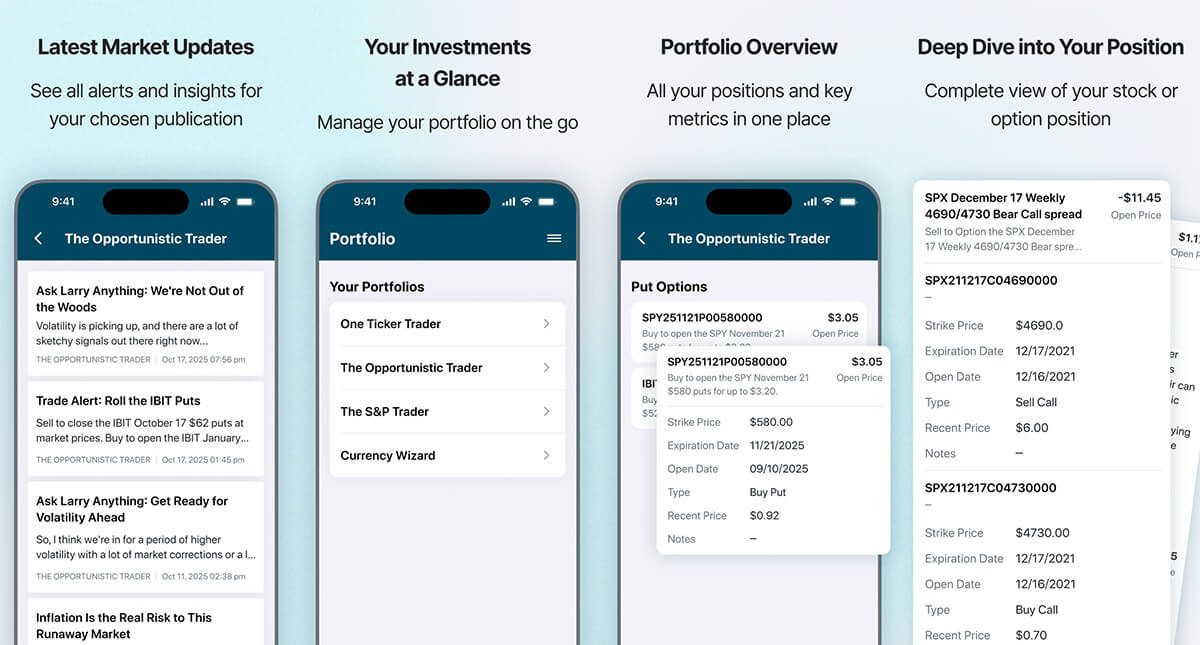
Click the icon below from your mobile device to download The Opportunistic Trader app today for one-tap access to trade alerts, issues, and model portfolios for all of Larry’s services.
|
|
Available in the app store on Android and iPhone.
|
|
|
|













No comments:
Post a Comment