|
|
|
Bitcoin has lost nearly half of its value since peaking above $125,000 last October. Now multiple catalysts are converging at the same time to drive the next big move.
|
|
That includes legislation making its way through Congress. The Clarity Act would help establish a regulatory framework for digital assets (including crypto) and is waiting for a vote in the Senate.
|
|
At the same time, investors will parse every word said and written following the Federal Reserve’s latest meeting this week.
|
|
New Fed Chair Kevin Warsh has already surprised investors with hawkish talk on inflation. The forward path of monetary policy will play a big part in driving market liquidity… and Bitcoin.
|
|
For crypto traders wondering how it will all play out, zooming out and tracking key chart levels can help tip the next move. Here’s what I’m watching…
|
| Recommended Links
Obscure Nasdaq “Glitch” Could Trigger on August 14 On August 14, an obscure market anomaly could send a fresh group of stocks soaring. The last few times this glitch appeared, certain stocks shot up 825%, 2,105%, and even 4,496% – in a matter of weeks and months. Wall Street insider Jason Bodner has created a way to track this “glitch” and potentially spot winners right before they break out. For a limited time, he is sharing all the details – including the name of his #1 stock, for free. Watch here>>>
WARNING: Watch This 30-Second Video And You'll HATE Your Bank... Your bank pays you 0.4%... if you're lucky. But these big banks have been keeping a secret... one they NEVER advertise to the general public. Bank of America, Wells Fargo, and JPMorgan use something called "The 29% Account." Since 2000... it has turned $1,000 into $565,000. Click here to see how you can open your own "29% Account" today...
|
|
|
Bitcoin’s Bearish Trend
|
|
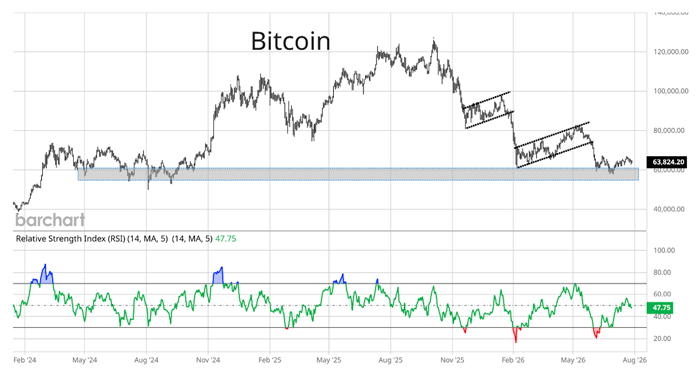
Following Bitcoin’s peak last October, the largest crypto by market value has settled into a recurring bearish chart pattern.
|
|
|
|
Here’s the chart below:
|
|
|
|
The dashed trendlines show the last two bear flag patterns. It’s when Bitcoin has traded inside a channel against the prevailing trend, which has ultimately led to new lows. It’s a bearish flag in this case because the pattern is upward sloping and formed within an overall downtrend.
|
|
That’s keeping the trend of lower highs and lower lows intact – the definition of a primary downtrend.
|
|
The most recent break brought Bitcoin right back to a key support level. The area around $60,000 (shaded zone) has been tested multiple times this year. It’s also a key congestion zone tested numerous times in 2024.
|
|
That makes the $60,000 area an important “make-or-break” level that you need to watch closely.
|
|
Here are the signs that would point to a major breakdown… and what could spark a rebound instead.
|
Tune in to Trading With Larry Live 
Each week, Market Wizard Larry Benedict goes live to share his thoughts on what’s impacting the markets. Whether you’re a novice or expert trader, you won’t want to miss Larry’s insights and analysis. Even better, it’s free to watch. Visit us on YouTube to catch the latest! |
|
|
Bitcoin’s Key Chart Levels
|
|
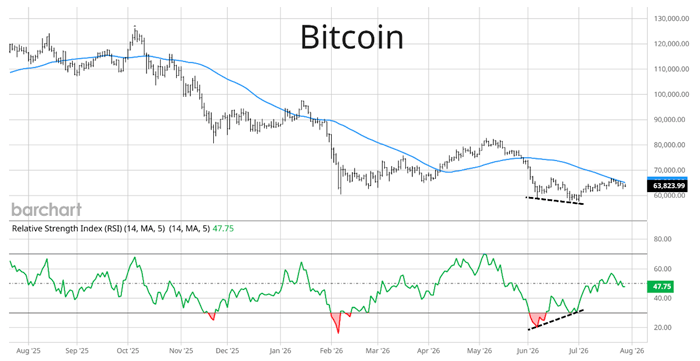
Bitcoin has seen a rally off the most recent test of $60,000, which was tipped by a positive momentum divergence.
|
|
Here’s the zoomed-in chart below.
|
|
|
|
The Relative Strength Index (RSI) tracks underlying price momentum. It made a higher low as Bitcoin briefly made a new low under $60,000 (dashed lines).
|
|
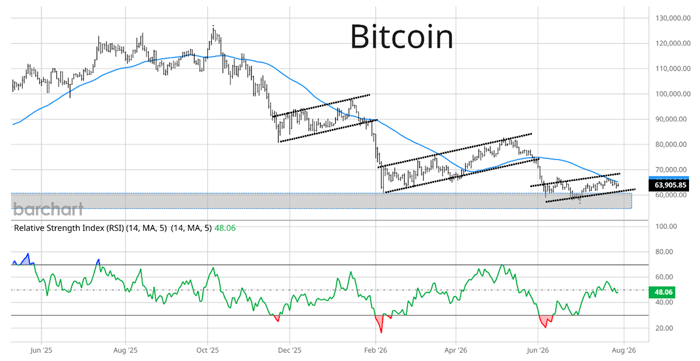
That bullish divergence at a key support level tipped a rebound. But now we have another bearish flag pattern emerging. Take another look at the chart.
|
|
|
|
The third set of dashed lines shows the latest flag pattern forming. At the same time, Bitcoin is testing resistance at the 50-day moving average (MA – blue line).
|
|
With all the catalysts in play, including the Fed and crypto legislation, we need to stay open to possible trade scenarios.
|
|
The first scenario is another breakdown out of the current bear flag pattern. That could put the $60,000 level back in play, where a sustained breach of support could lead to another sharp move lower.
|
|
But a false breakdown alongside another momentum divergence (like the RSI example noted above) could deliver a powerful reversal higher.
|
|
Those are the scenarios that you need to watch for the next big move in Bitcoin – and how you can use technical analysis to stay objective amid all the noise.
|
|
Happy Trading,
|
|
Larry Benedict
|
|
|
Get Instant Trade Alerts on Mobile!
|
|
|
|
Click the icon below from your mobile device to download The Opportunistic Trader app today for one-tap access to trade alerts, issues, and model portfolios for all of Larry’s services.
|
|
Available in the app store on Android and iPhone.
|
|
|
|














No comments:
Post a Comment