How to Trade the Coming PullbackBy Larry Benedict, editor, Trading With Larry Benedict Liquidity is the lifeblood of stock prices, especially in the most speculative areas of the markets. Liquidity impacts the cost and availability of credit. When credit is cheap and plentiful, companies will borrow to expand their businesses and work on new developments. That tends to benefit risky assets like stocks and crypto the most. The opposite is also true. Entering 2026, liquidity tailwinds seemed likely. The Federal Reserve looked set to keep cutting interest rates. That’s changing quickly, though. We’ve had a surge in inflation, and the job market is still holding up. That erased most hopes for cuts. Now investors are pricing in rate hikes as soon as December. So it should be no surprise if speculative areas of the market pull back in response. So today, let’s dig into how you can profit from these shifting dynamics with one specific asset class…
| Recommended Links
Is a 37% Crash Coming? The CEOs of Morgan Stanley and Goldman Sachs are warning of a “major correction” ahead… But the last time stocks crashed 37%, hedge fund legend Larry Benedict made $95 million. His secret? He doesn’t buy stocks. He “skims” them. His “Skim Code” strategy can target payouts of $6,361 in a single week… while ordinary investors lose money. And now he’s revealing the whole thing, so you can go for gains whether the market goes UP, DOWN, or sideways. [Get His Crash-Proof Strategy Here]
Buy These Stocks Before the SpaceX IPO The SpaceX IPO could send a new group of stocks soaring. Jeff Brown’s colleague, Jason Bodner, has created a way to potentially spot these stocks right before they break out 86%, 213%, 367%, and even 911%, in a matter of weeks and months. No options. No high-risk penny stocks. Just buying and selling stocks through your existing brokerage account. For the next few days only, Jeff and Jason are revealing the details – including the name of a top pick. Watch here.
|
Bitcoin’s Bear FlagBitcoin is extremely sensitive to liquidity trends. It is among the first assets to respond to changing financial conditions. Perhaps it’s no coincidence that Bitcoin offered an early warning about the liquidity challenges that are now emerging. After all, the cryptocurrency peaked last October and has fallen as much as 51%. I had this to say at the end of March:
Following a steep decline into late November, Bitcoin created a pattern called a “flag,” shown with the dashed lines. It’s a bearish flag in this case because the pattern is upward sloping and formed within an overall downtrend.
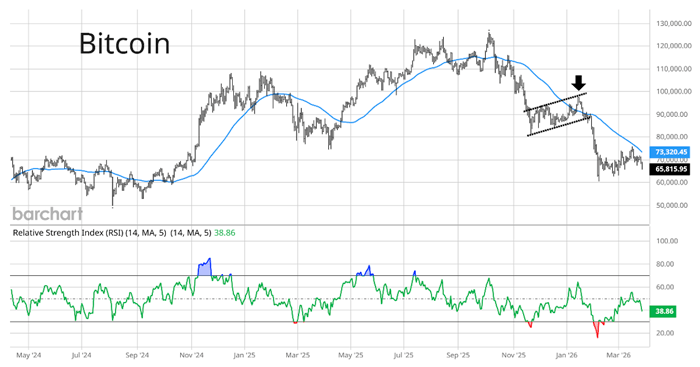
(Click here to expand image)
After a failed breakout over the 50-day moving average (MA – blue line) at the arrow, Bitcoin broke down from the flag pattern in late January. A sharp drop followed, taking the crypto to the $60,000 level. That was a key support level not seen since heading into November 2024’s elections. Vitally, that breakdown warned of souring investor risk appetite well before the U.S. started a war with Iran and the Nasdaq fell to its lowest level in over six months. Bitcoin stabilized at a critical level… but is now creating the same bearish pattern again.
Here’s the updated Bitcoin chart below. 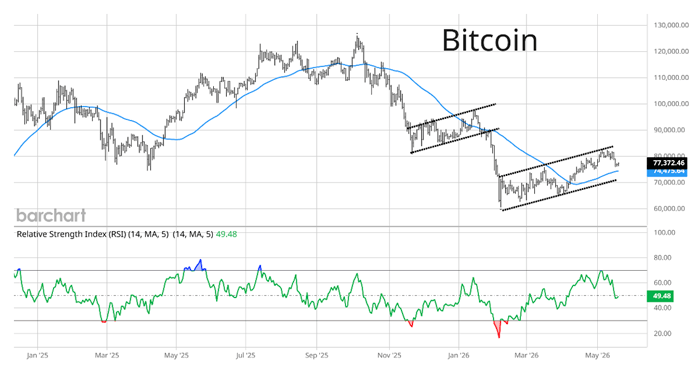
(Click here to expand image) Bitcoin is still trading inside the second bearish flag pattern that I highlighted at the end of March. With challenges continuing to build, I expect Bitcoin to break down from the pattern. If that happens, there will be trading opportunities in stocks that are highly correlated to Bitcoin’s trend.
Tune in to Trading With Larry Live 
Each week, Market Wizard Larry Benedict goes live to share his thoughts on what’s impacting the markets. Whether you’re a novice or expert trader, you won’t want to miss Larry’s insights and analysis. Even better, it’s free to watch. Simply visit us on YouTube at 8:30 a.m. ET, Monday through Thursday, to catch the latest. |
Watch This Crypto StockWith over 100 million users, Coinbase (COIN) is the largest cryptocurrency exchange in the U.S. and the largest global Bitcoin custodian. As you would expect, COIN tends to mimic Bitcoin’s price movements. COIN is also progressing through its own bear flag pattern… and it’s taking place at a key support level. Here’s the COIN chart below: 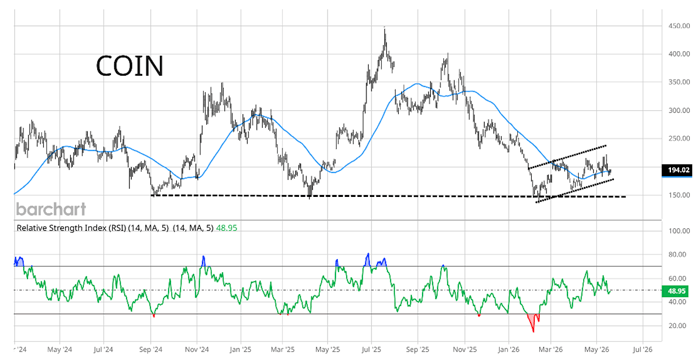
(Click here to expand image) The trend channel shows COIN’s flag pattern that’s been forming since February. That coincided with a rally off support at the $145 level. The dashed trendline shows the importance of that support area, which has been tested several times going back to late 2024. A breakdown of the flag pattern could lead to another test of that support level. Given Bitcoin’s own bearish pattern and the growing headwinds to the liquidity outlook, COIN could be setting up a major breach of support. If a break of support appears imminent, one way to take advantage of the downside is put options. Puts gain in value when the underlying price of a security is falling. Options are also a “defined risk” strategy, so you know how much capital is at risk on any given trade. Assets sensitive to liquidity trends have been pulling back since late last year. The next downtrend could be just around the corner. That could finally be the trading opportunity I’ve been waiting for. So if you’d like to follow along with my next trade alert, be sure to check out one of my favorite strategies right here. Happy Trading, Larry Benedict
Editor, Trading With Larry Benedict
Free Trading Resources Have you checked out Larry’s free trading resources on his website? It contains a full trading glossary to help kickstart your trading career – at zero cost to you. Just click here to check it out. |
|


No comments:
Post a Comment