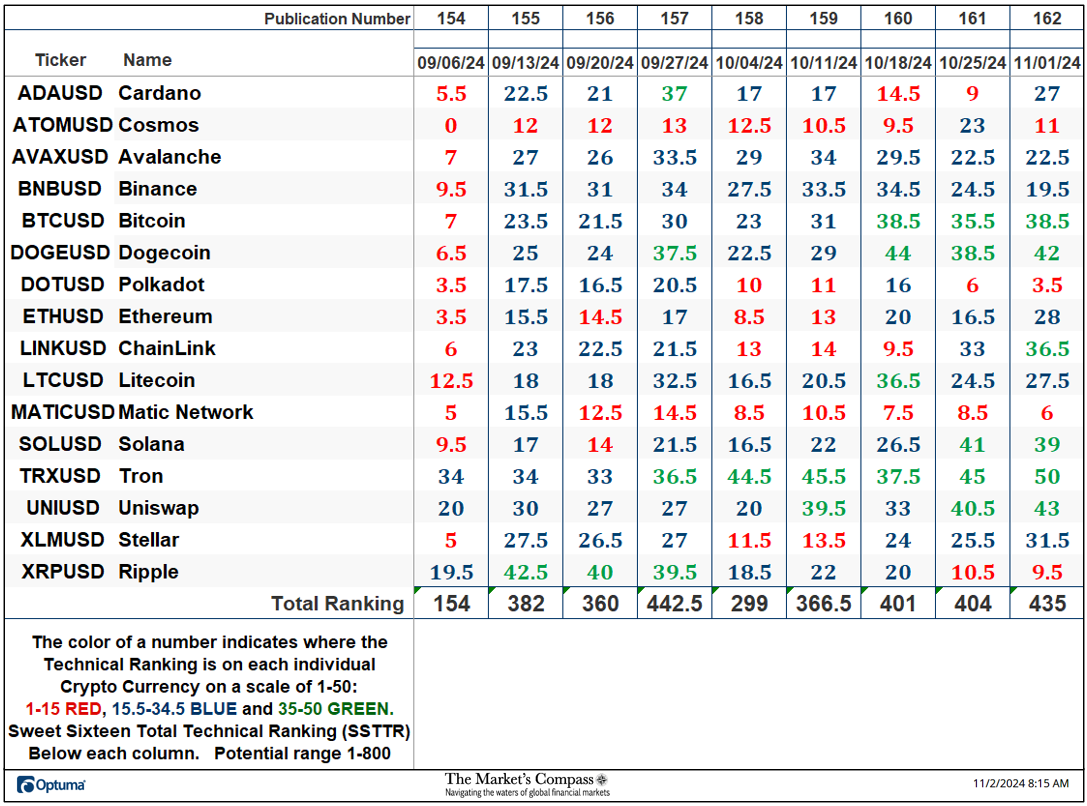
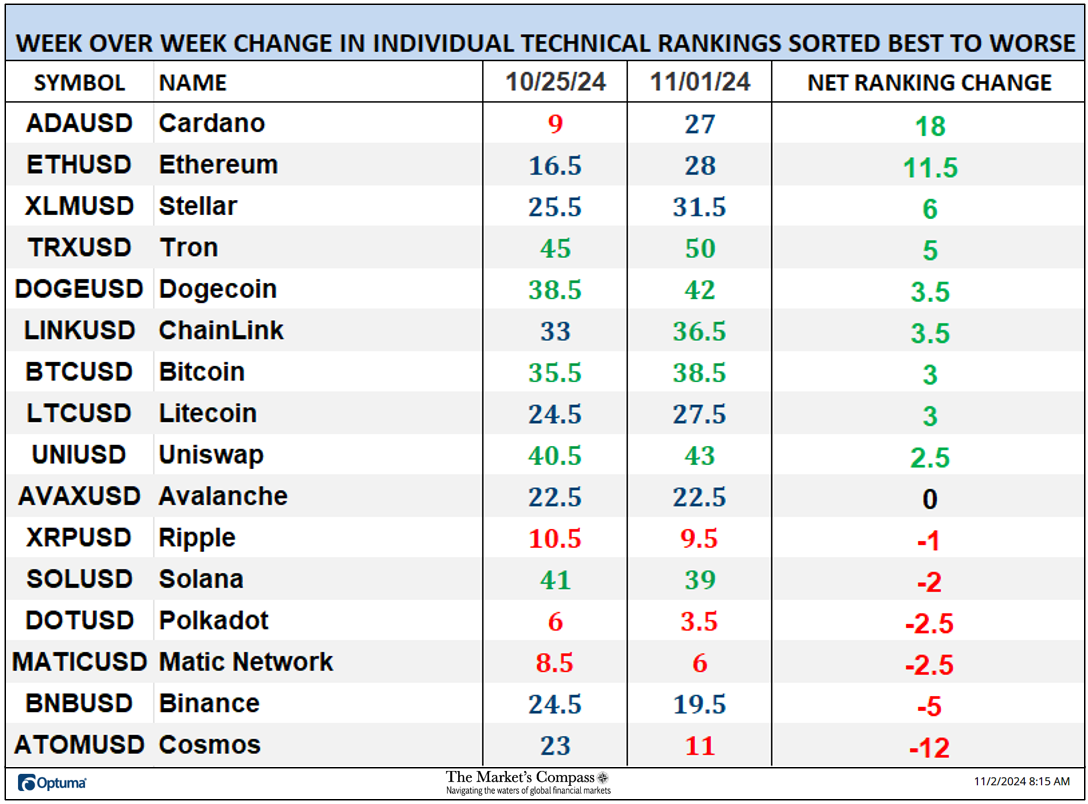
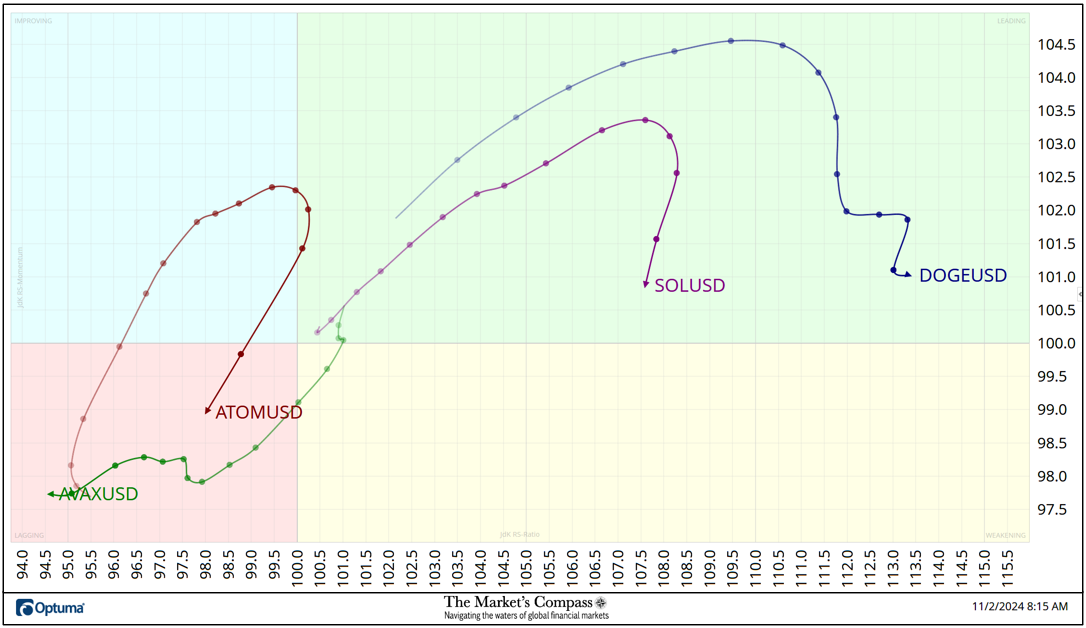
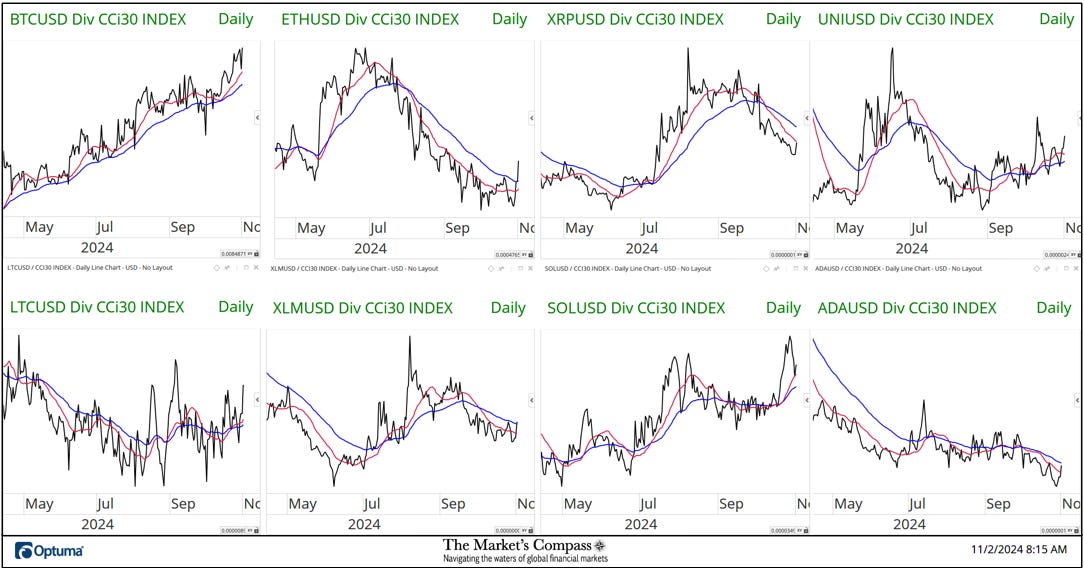
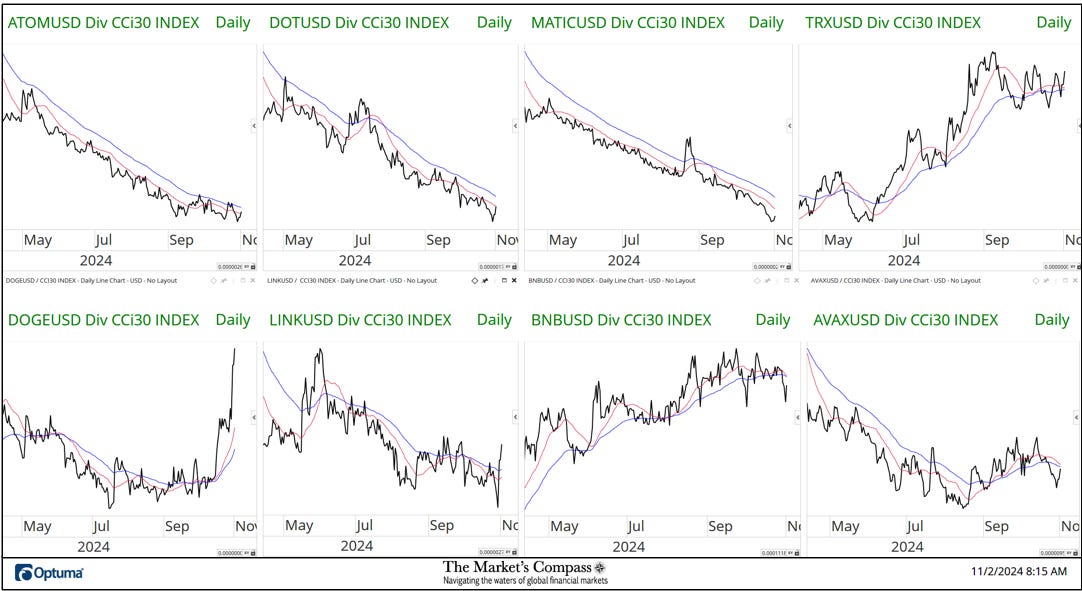
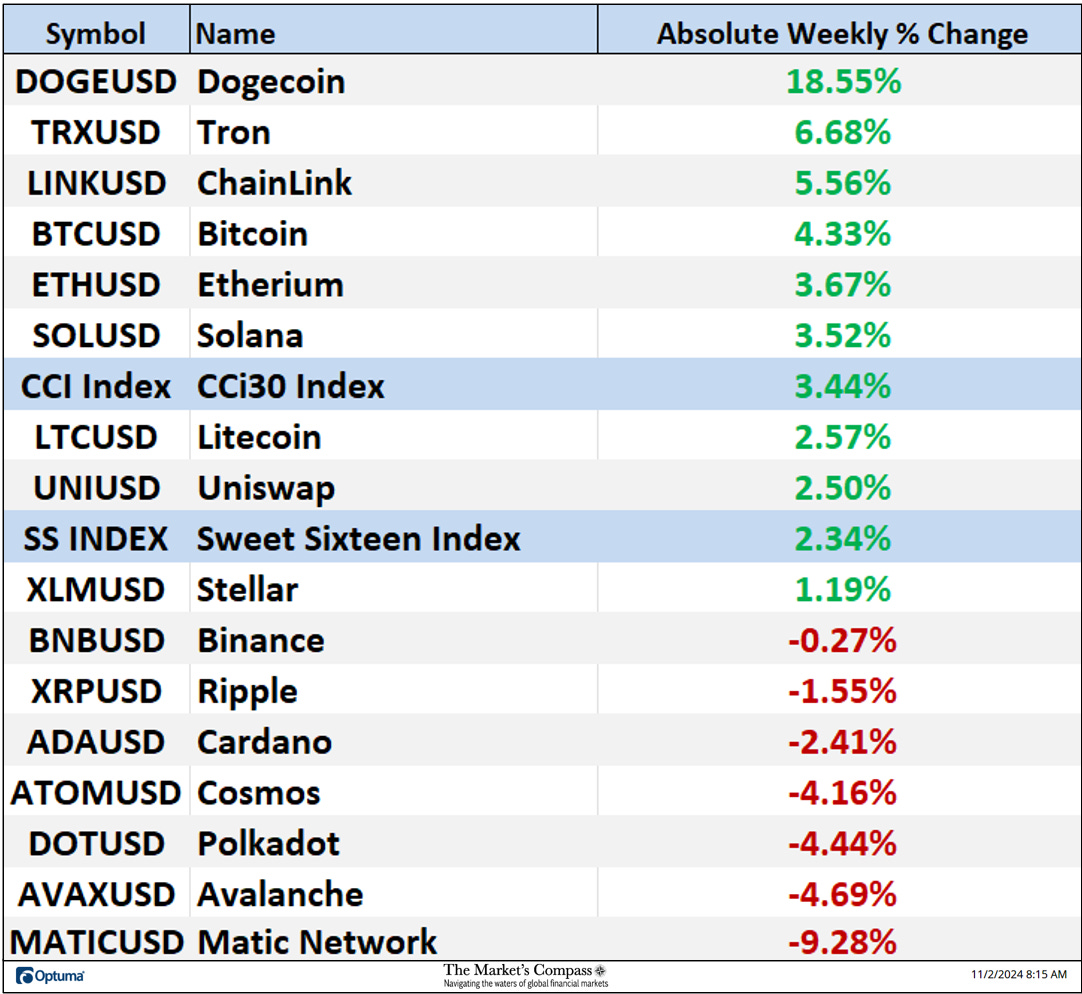
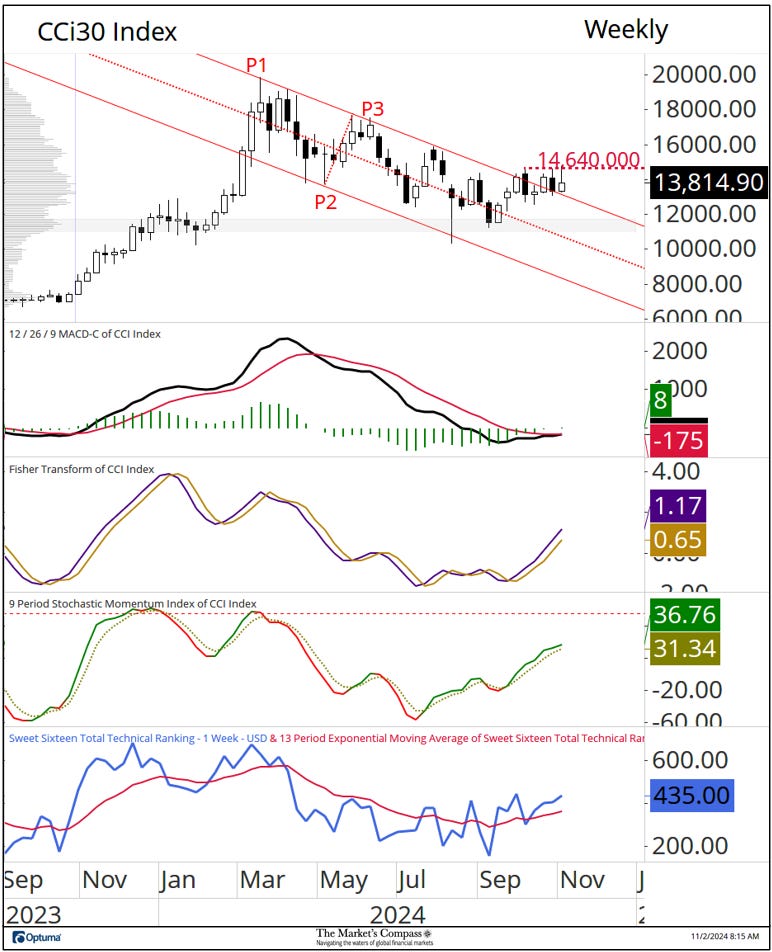
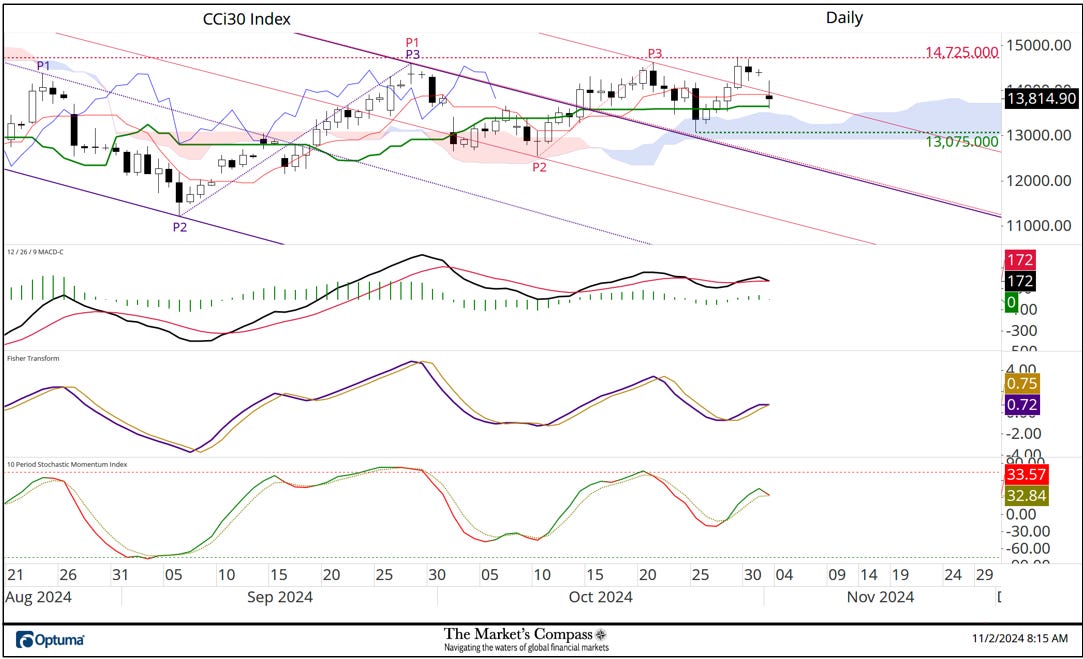
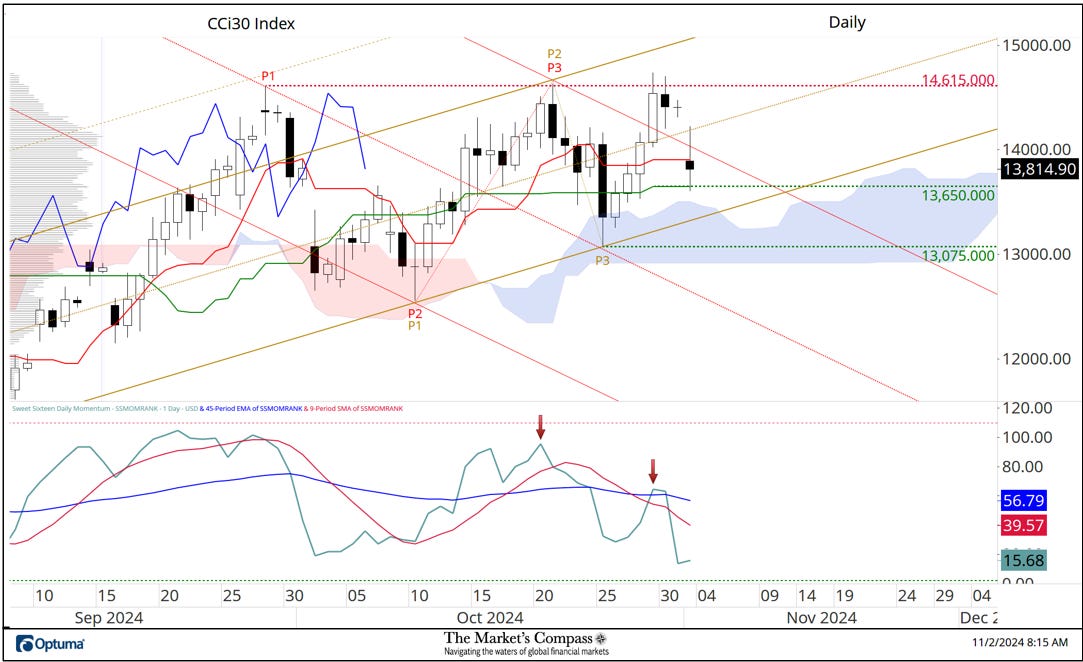
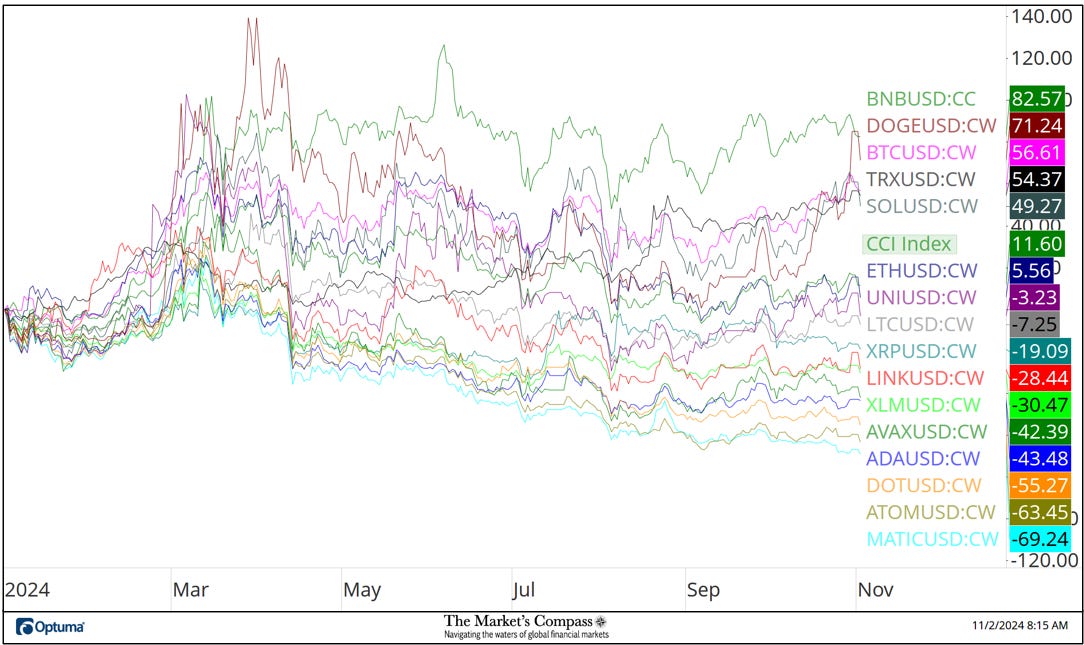
Welcome to last week’s publication of the Market’s Compass Crypto Sweet Sixteen Study #162 that was sent to my paid subscribers on Sunday and is being resent as an Election Day Special to my free subscribers. For one day only, elect to become a paid subscriber at a 25% discount ($75 a year) to receive the unabridged Weekly Crypto Sweet Sixteen Studies that tracks the technical condition of sixteen of the larger market cap cryptocurrencies. Every week the Studies will highlight the technical changes of the 16 cryptocurrencies that I track as well as highlights on noteworthy moves in individual Cryptocurrencies and Indexes. You will also be sent to your e-mail, the Weekly ETF Studies that tracks 70 U.S Index and Sector ETFs, Developed Country ETFs, and Emerging Market ETFs as well as one off multi-time frame index studies. This Week’s and 8 Week Trailing Technical Rankings of the Sixteen Individual Cryptocurrencies**An explanation of my objective Individual Technical Rankings go to www.themarketscompass.com. Then go to the MC’s Technical Indicators and select crypto sweet 16. The Excel spreadsheet below indicates the weekly change in the objective Technical Ranking (“TR”) of each individual Cryptocurrency and the Sweet Sixteen Total Technical Ranking. *Rankings are calculated up to the week ending Friday November 1st Last week the Sweet Sixteen Total Technical Ranking or “SSTTR”, rose +7.67% to 435 from 404 the previous week ending October 25th but remains below the September 27th reading of 442.5 which marked the best level in the SSTR since April 15th reading of 549.5. Nine weeks ago, the SSTTR reached an oversold reading of 154, which was the lowest reading since June 17, 2022, when the SSTTR was at 94. Last week nine of the Sweet Sixteen Crypto TRs rose, one was unchanged, and six fell. (of the nine that rose, Stellar (XLM), Tron (TRX), ChainLink (LINK), and Uniswap (UNI) registered TR gains for the second week in a row). That was vs. the week before when seven of the Sweet Sixteen Crypto TRs rose, and nine crypto TRs fell. The average Crypto TR gain last week was +1.94 vs. the previous week’s average gain of +0.19. Five of the Sweet Sixteen crypto TRs ended the week in the “green zone”, six TRs were in the “blue zone” (TRs between 15.5 and 34.5), and four were in the “red zone” (TRs between 0 and 15). The previous week five of the Crypto TRs were in the “green zone”, seven were in the “blue zone”, and four were in the “red zone”. Relative Strength and Weakness in the Sweet Sixteen vs. The CCi30 Index* utilizing a Relative Rotation Graph*The CCi30 Index is a registered trademark and was created and is maintained by an independent team of mathematicians, quants and fund managers lead by Igor Rivin. It is a rules-based index designed to objectively measure the overall growth, daily and long-term movement of the blockchain sector. It does so by indexing the 30 largest cryptocurrencies by market capitalization, excluding stable coins (more details can be found at CCi30.com). A brief explanation of how to interpret RRG charts can be found at The Market’s Compass website www.themarketscompass.com Then go to MC’s Technical Indicators and select crypto sweet 16. To learn more detailed interpretations, see the postscripts and links at the end of this Blog. Although Dogecoin (DOGE) began to lose a good measure of Relative Strength Momentum a week ago, last Friday, it maintained positive Relative Strength vs. the CCi30 Index, and that downside momentum is beginning to slow. Solana (SOL) rolled over in the Leading Quadrant early last week losing Relative Strength Momentum but still sports the number two slot in Relative Strength. Avalanche (AVX) has registered a three Quadrant move by falling out of the Leading Quadrant two Monday’s ago, through the Weakening Quadrant and besides a brief recovery attempt it is continuing to track lower. Cosmos (ATOM) has done a complete U turn after an attempt to advance into the Leading Quadrant and at the end of last week it accelerated lower back into the Lagging Quadrant marking the worst Relative Strength of the Sweet Sixteen. What’s in Your Wallet?The two charts below are longer term line charts of the Relative Strength or Weakness of the Sweet Sixteen Crypto Currencies vs. the CCi30 Index that are charted with a 55-Day Exponential Moving Average in blue and a 21-Day Simple Moving Average in red. Trend direction and crossovers, above or below the longer-term moving average, reveal potential continuation of trend or reversals in Relative Strength or Weakness. Note the Relative Strength reversal in Dogecoin (DOGE) above and Weekly absolute price performance below. Seven Day Absolute % Price Change**Friday October 25th to Friday November 1st. Nine of the Crypto Sweet Sixteen registered absolute gains last week and seven lost absolute ground versus the previous week when five of the Crypto Sweet Sixteen registered absolute gains and eleven lost ground. The standout absolute performer was Dogecoin (DOGE) which was up +18.55% over the seven-day period vs. Matic Network (MATIC) which was down -9.28% (that was in addition to the -10.20% drop the week before). The seven-day average absolute price gain was +1.53% versus the previous week’s average absolute loss of -2.01%. The Technical Condition Factor* changes for the week ending October 18th with the trailing eight weeks added.*An explanation of my The Technical Condition Factors go to www.themarketscompass.com. Then go to the MC’s Technical Indicators and select crypto sweet 16. The DMTCF rose last week to 49.11% or 55 out of a possible 112 (a neutral reading). As a confirmation tool, if all eight TCFs improve on a week over week basis, more of the 16 Cryptocurrencies are improving internally on a technical basis, confirming a broader market move higher (think of an advance/decline calculation). Conversely, if more of the TCFs fall on a week over week basis, more of the “Cryptos” are deteriorating on a technical basis confirming the broader market move lower. Last week six TCFs rose, and two fell. A brief explanation on how to interpret the Sweet Sixteen Total Technical Ranking or “SSTTR” vs the weekly price chart of the CCi30 Index go to www.themarketscompass.com. Then go to the MC’s Technical Indicators and select crypto sweet 16. At the end of last weekThe CCi30 Index was capped once again, at the 14,640 level but the index did manage to hold the ground above the Upper Parallel (solid red line) of the Schiff Modified Pitchfork (red P1 through P3). That said, the sideways price action continues as witnessed by MACD which is also tracking sideways but both the Fisher Transform and the Stochastic Momentum Index are still climbing higher above their signal lines. The Sweet Sixteen Total Technical Ranking or SSTTR edged higher last week. If prices are able to hold support at the Upper Parallel and gather enough stream to overtake and close next week above resistance at the 14,640 level, I would feel comfortable saying that the CCi30 Index is out of the woods. The CCi30 Index Daily Chart with Momentum OscillatorsIn last week’s Crypto Study, we suggested that “the longer-term Standard Pitchfork’s (violet P1 through P3) Upper Parallel (violet solid line) and the shorter-term Standard Pitchfork’s (red P1 through P3) Median Line are directly on top of each other which should mark a confluence of support if support at the Kijun Plot and the Cloud are violated”. That technical scenario unfolded and dual support held a rally unfolded. Although the index traded above red P1 and P3 price pivot highs on an intra-day basis, the index retreated from the daily highs on Tuesday and Wednesday. On Friday the index fell back below the Upper Parallel (solid red line) of the Standard Pitchfork. Friday’s weakness has led to all three secondary indicators to roll over. I now mark first support at 13,075 which is just above the lower span of the cloud. More short-term technical details follow… The CCi30 Index Daily Chart with the Sweet Sixteen Daily Momentum / Breadth Oscillator.As I mentioned above the index failed at price resistance early last week. The Sweet Sixteen Daily Momentum / Breadth Oscillator printed a lower high (second red arrow) and rolled over producing a glaring non-confirmation of the rally attempt and on Friday the index fell below the Median Line (gold dotted line) of the Schiff Modified Pitchfork (gold P1 through P3) and the Upper Parallel (solid red line) of the Standard Pitchfork (solid red line). The only saving grace was support at the Kijun Plot at 13,650. I expect the wide sideways chop to continue at the very least into the middle of next week. Year to Date Comparative Price Performance of the Sweet SixteenAll of the charts are courtesy of Optuma whose charting software enables users to visualize any data such as my Objective Technical Rankings. Cryptocurrency price data is courtesy of Kraken. The following links are an introduction and an in-depth tutorial on RRG Charts… https://www.optuma.com/videos/introduction-to-rrg/ https://www.optuma.com/videos/optuma-webinar-2-rrgs/ To receive a 30-day trial of Optuma charting software go to… A three part tutorial on Median Line Analysis, AKA Andrews Pitchfork, and a basic tutorial on the Tools Technical Analysis is available on my website… |
Tuesday, November 5, 2024
The Market’s Compass Crypto Sweet Sixteen Study
Subscribe to:
Post Comments (Atom)
🚧 Tariff szn is in
Sorry, no decoupling after all ...

-
L'actualité des BeaBoss chaque jour Pensez à ajouter cette adresse à votre carnet...
-
L'actualité des BeaBoss chaque jour Pensez à ajouter cette adresse à votre carnet...
-
Hollywood is often political View in browser The Academy Awards ceremony is on Sunday night, and i...

No comments:
Post a Comment