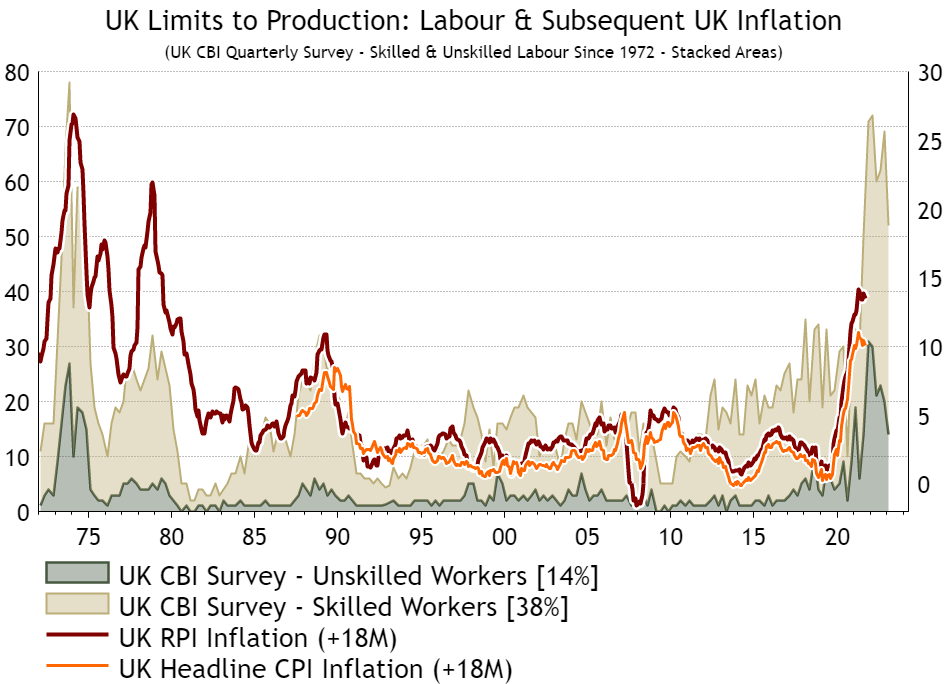
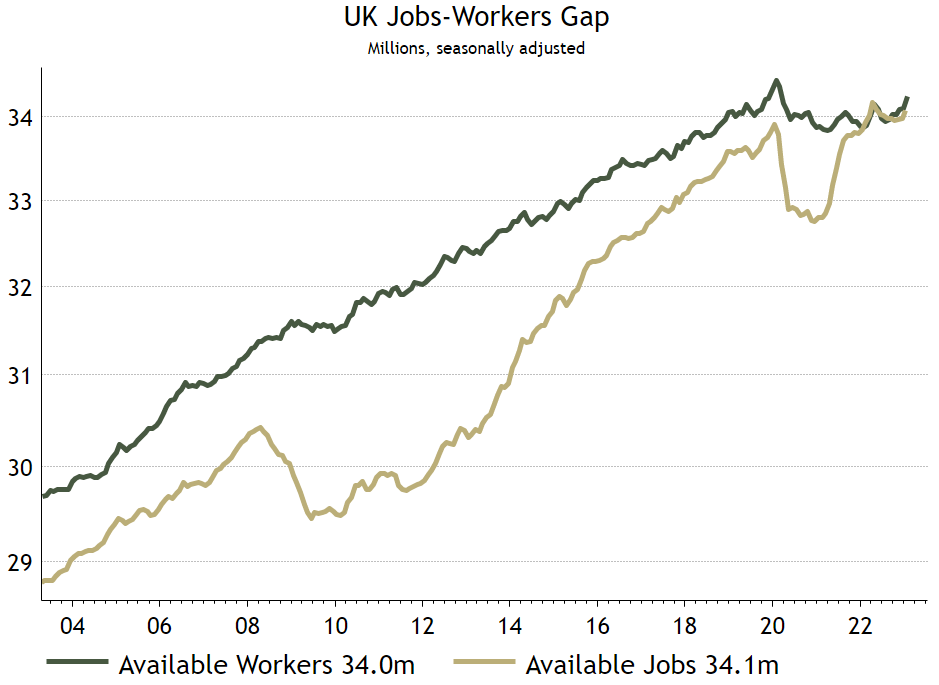
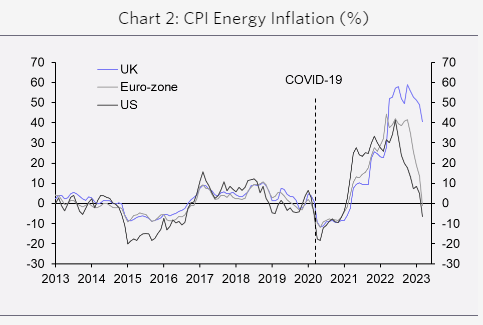
| The British are famous for their idiosyncrasies. They gave the world Monty Python and Benny Hill, after all, along with plenty of Blackadder. They also, at the moment, are burdened with an inflation problem, or "Cost-of-Living Crisis," that seems more severe than the rising prices elsewhere in the developed world. How much of this can be dismissed as idiosyncratic? Last month's US banking failures appear to have been largely labeled idiosyncrasies as the affected banks had extreme positioning. Others were unscathed. It would be encouraging if Britain's inflation rate, which on Wednesday we learned to great disappointment continues to be above 10%, could be similarly dismissed. So, can we explain away the fact that the UK's headline inflation has now been in double figures for seven consecutive months, and appears alarmingly entrenched? There is a way to do it, and it involves the labor market. While vacancies are unusually high across the developed world, making it far harder than usual for employers to attract workers, the problem seems to be far more acute in Britain. The following chart from Capital Economics compares wage growth in the UK, the euro zone and the US. The UK, where it is running above 6% and a range of public-sector strikes threaten to push it higher, looks like a clear outlier: 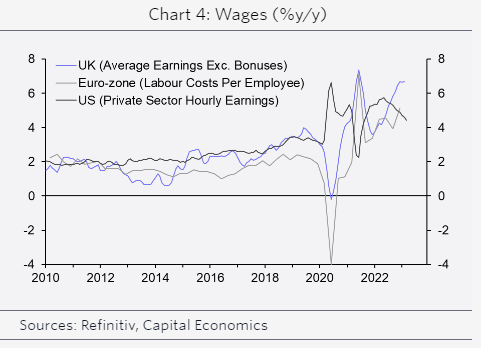 While the risk of a wage-price spiral remains notional in continental Europe and the US, it looks to be a far more significant threat in the UK. And there is a clear reason for this: The UK has the kind of labor shortage that in the past has driven higher inflation. The following chart from Absolute Strategy Research shows the percentage of respondents to a regular Confederation of British Industry survey complaining it was difficult to find workers. The numbers have begun to recede, but remain historically high — and, as the chart shows, such shortages tend to drive up inflation with an 18-month lag: Another way to look at this is that the available workforce has stagnated and is still below pre-pandemic levels, while the number of available jobs has caught up. With no gap between the two, it's natural that companies might need to raise wages to fill vacancies: Crucially, there is a reason why the extreme shortage of labor in the UK might be exceptional. It's about Brexit. The referendum campaign seven years ago was dominated by the issue of immigration. Exit from the EU, combined with the restrictions during the pandemic, has depleted the pool of laborers available to British employers. That is now being felt in prices. Another line for those in the rest of the world hoping to ignore the UK is that the country has had far greater problems dealing with energy prices. This is the explanation offered by Ruth Gregory, deputy chief UK economist at Capital Economics: The leap in wholesale energy prices since the pandemic, and worsened by the war in Ukraine, was much bigger for the UK/euro-zone than for the US. Moreover, some euro-zone governments capped prices sooner and by more than in the UK. The UK regulator's price mechanism means that energy prices are slower to fall back too. CPI energy price inflation peaked at 41.3% in June 2022 in the US and at 44.3% in March 2022 in the euro-zone. In the UK, it peaked at 59.0% and has stayed comparatively high since.
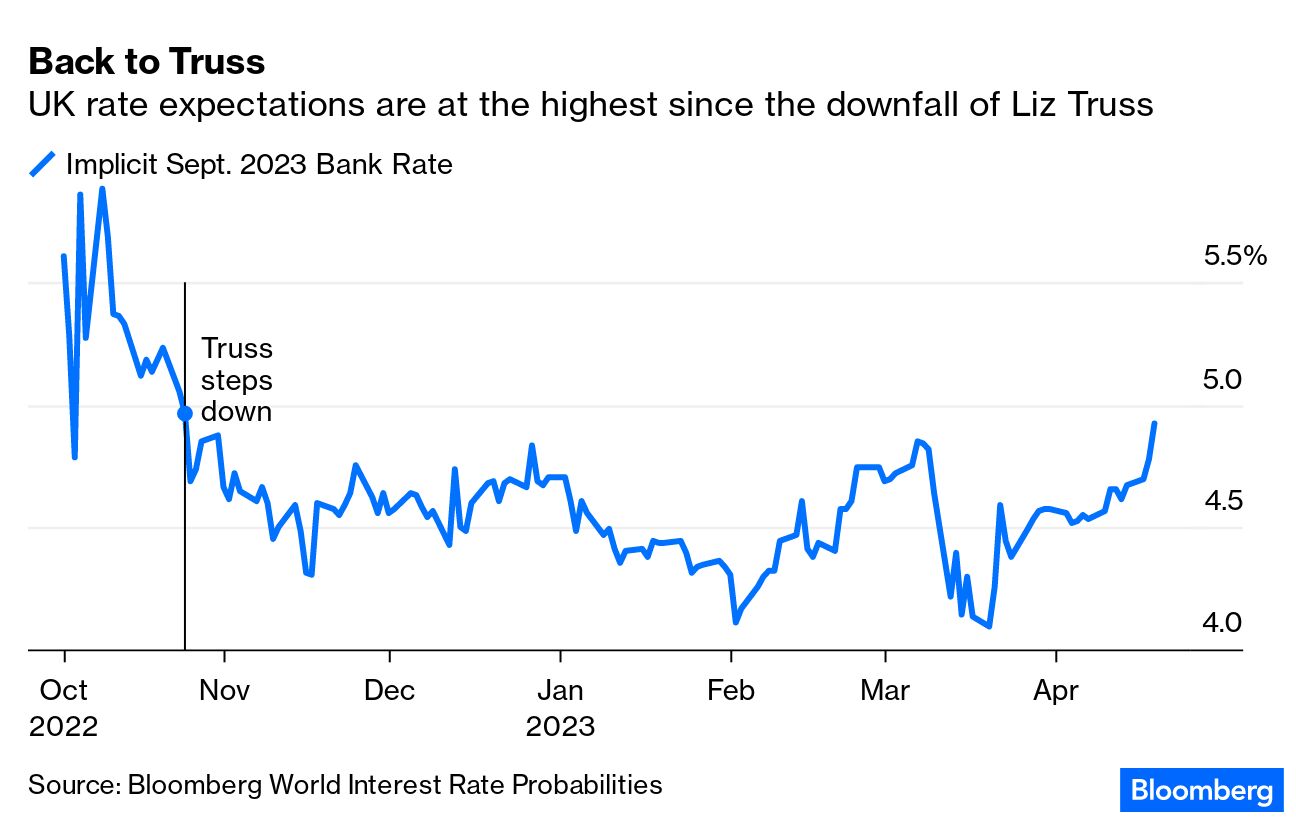
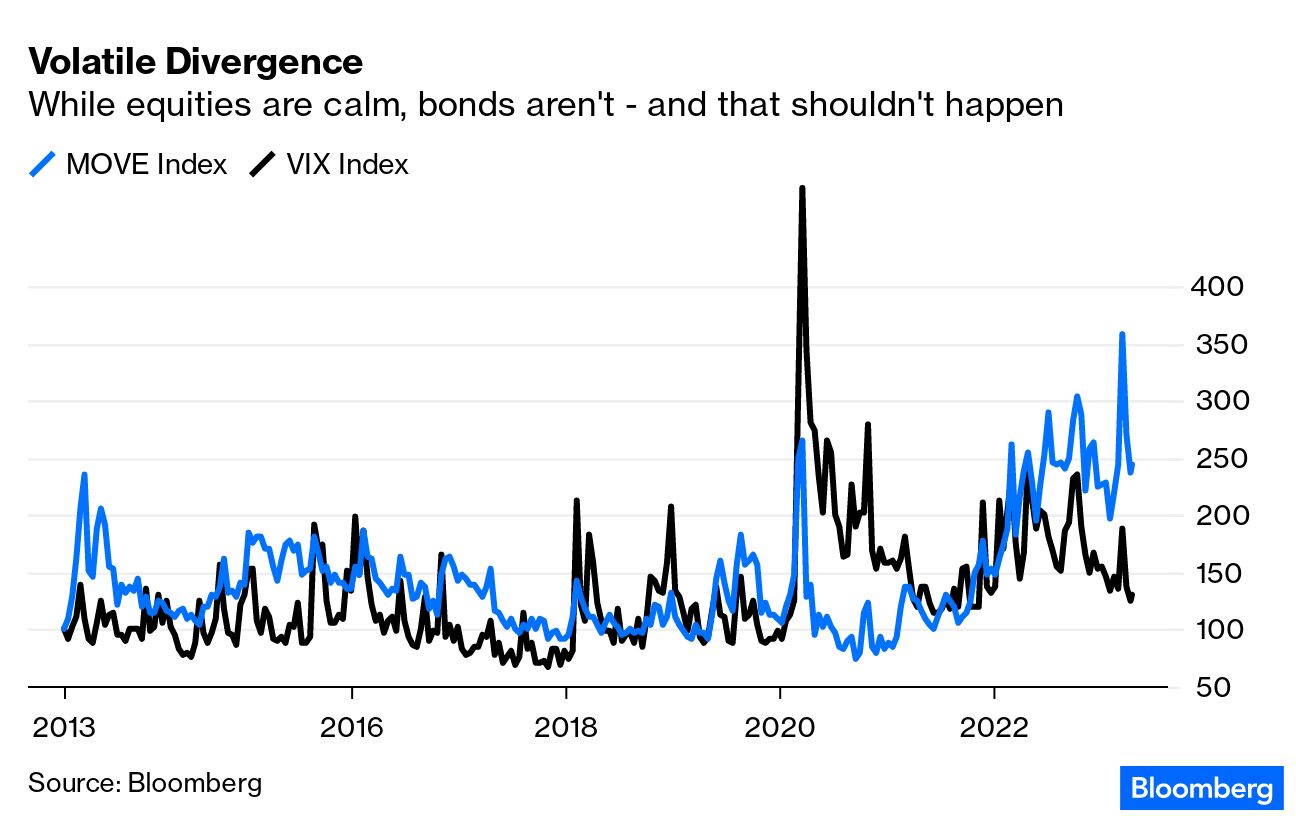
This chart illustrates that phenomenon: That's the argument for exceptionality, and there's a lot to it. The UK had better be unlike the rest, because rate expectations have jolted sharply higher on the back of the news. The overnight index swap market currently suggests that the Bank Rate will be almost 5% after the Bank of England's September monetary policy meeting. That's its highest since Liz Truss stood down as prime minister last October in the wake of a bond market implosion. This is the exact opposite of the direction of travel many in the market were hoping to see: These are all good reasons to expect the UK to have higher inflation than its developed-market peers. That was also true in the 1970s, and the UK was the only country to have to deal with any serious price rises in the immediate aftermath of the Global Financial Crisis. Its travails are no reason to expect double-digit inflation to embed itself everywhere else. However, the UK is not alone in having a very tight labor market, and a resurgence in energy prices, were it to happen, would affect everyone. Britain has some specific issues, several of its own making, but it's not as though it's being run by the Ministry of Silly Walks. Best to treat it as a case of what could happen if policymakers aren't careful. Volatility is never relaxing. But at present, many on Wall Street are spooked by its absence from the stock market. Bond market volatility has been intense in recent weeks, as sentiment over inflation amid confusion over the direction of monetary policy has gone through wild swings. That makes the relative calm in the VIX Index of volatility in the S&P 500, which has plummeted to a 52-week low, somewhat of a head-scratcher. Also known as the "fear index," the VIX is a gauge of options cost tied to the S&P 500. It typically pivots higher in times of turmoil. That it has barely reacted to the sharp market gyrations in the past months is beginning to raise alarm. The following chart shows the VIX and the MOVE index of bond volatility, both rebased at 100, starting 10 years ago: Getting really technical, Christopher Jacobson at Susquehanna International Group, points out that "vol of vol" levels appear to have found a floor in recent weeks, and are now picking up even as the VIX itself ticks lower. Since the end of March, the VIX is down nearly 12%, while the VVIX, measuring the volatility of the VIX, is up 3%. So it's possible that equity volatility is in the process of turning up. Some have suggested the market's hope of the Federal Reserve easing its aggressive monetary-policy tightening in the second half of the year as the reason for the VIX's muted reaction. On this argument, the banking crisis only improved the chance of rate cuts, and hence calmed the VIX. Swaps traders are now pricing in a final hike in May. But if history is any guide, Fed rate cuts tend to only occur when the VIX is higher than its long-run average of 20, Nicholas Colas, co-founder of DataTrek Research, wrote in a Wednesday note. He asks: "Will the Fed really cut rates if equity markets remain quiet all year? The historical record suggests that is unlikely." Diving deeper, Colas analyzed the historical relationship between the VIX and the federal funds rate. The chart below shows the VIX (black line) and the fed funds rate (red line) dating back to 1990. The dashed line is the VIX's average of 20: 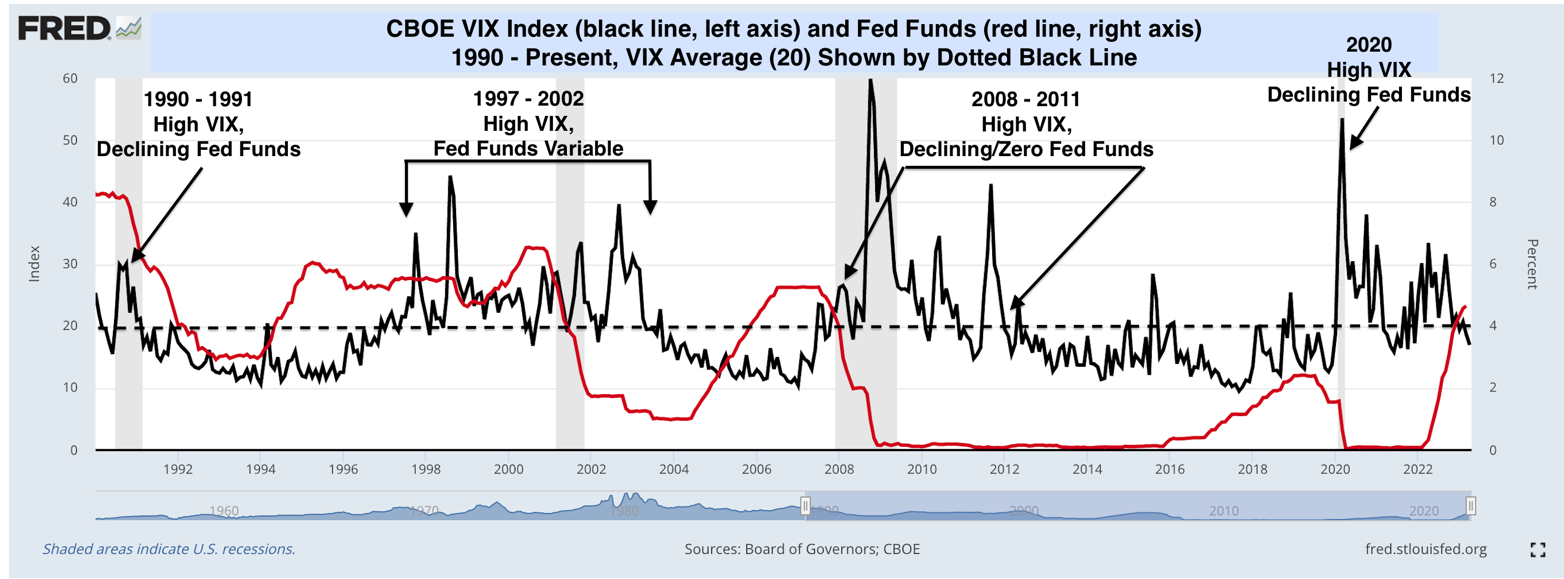 Source: DataTrek Research A couple of takeaways from Colas: The Fed often, but not always, cuts rates when stock-market volatility rises sharply. Instances, including the 1990 Iraqi invasion of Kuwait, the 1998 Asia Crisis, entering the 2002 and 2008 recessions, and the onset of the 2020 pandemic, prove this point. And higher stock-market volatility does not always go hand-in-hand with a Fed tightening cycle. For instance, VIX levels were lower during the 2004–2007 rate cycle and most of the 2016–2019 cycle: We almost certainly need a spike in stock market volatility to push the Fed to ease as expected in the second half of 2023 ... the market is very far from telling the Fed they need to reduce short term interest rates. Between now and those expected rate cuts later this year we will, therefore, need to see the sort of volatility that pushes the Fed to act. Otherwise, why would the Fed do anything other than keep rates where they are? As far as we're concerned, this is the real "Fed put."
US stocks have advanced sharply year-to-date, with the S&P 500 rising north of 8% and the tech-heavy Nasdaq 100 posting double-digit gains. But headwinds remain, including stubborn inflation, growing recession risks and a debt ceiling debacle. Aside from the VIX, much talked about is also the yield-curve weighted ICE BofA MOVE index, a closely watched Treasury volatility measure. It has plunged 40% after reaching its highest point since 2008 in March and more than doubling from the end of January. Stan Shipley of Evercore ISI pointed to the widening gap between the implied volatility metrics of Treasury and equity markets, which have historically had a high correlation. Much of it is due to different macroeconomic outlooks: The "Move" index is quite high (recession territory) and is consistent with a volatile economic climate and financial shocks whipsawing Treasury yields. However, equity volatility is low. The macro-outlook for equity volatility is closer to a 'soft' landing where yields do not move significantly nor is there an onslaught of financial shocks whipsawing equity prices and credit spreads.
Gaps aren't unprecedented — they occurred in 2015 and late 2020 to early 2021. However, Shipley notes the current one has lasted longer then expected: "This gap is now almost 14 months old. It is several months past due to narrow." Similar arguments apply to the technology sector, where companies are currently perceived to benefit from lower bond yields. Research firm Quant Insight sees two scenarios under which tech stocks look fairly fully priced: - If the rates market is too bearish and bond yields rise, that removes a crucial pillar supporting tech outperformance.
- If the equity view is wrong, then we likely see a market with rich valuations facing a recession, credit crunch, risk-off reaction with rising volatility, and wider credit spreads. Then, technology as a high beta play again looks vulnerable.
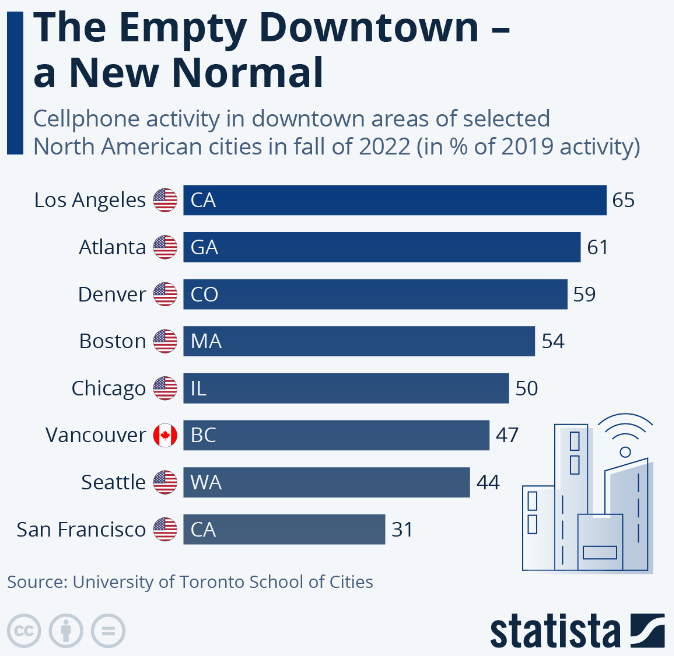
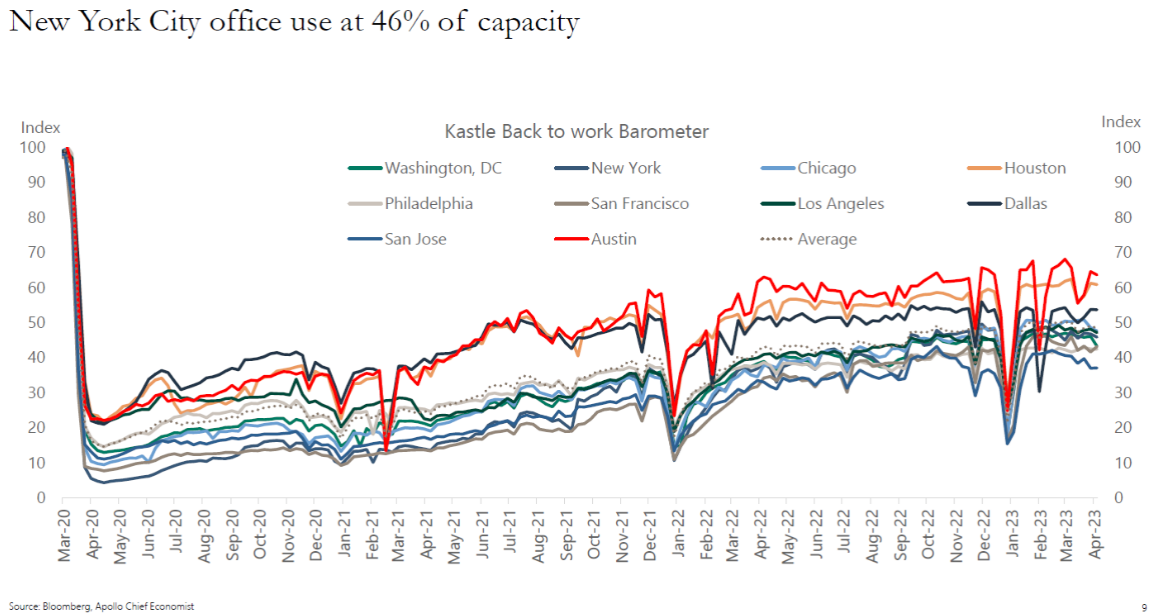
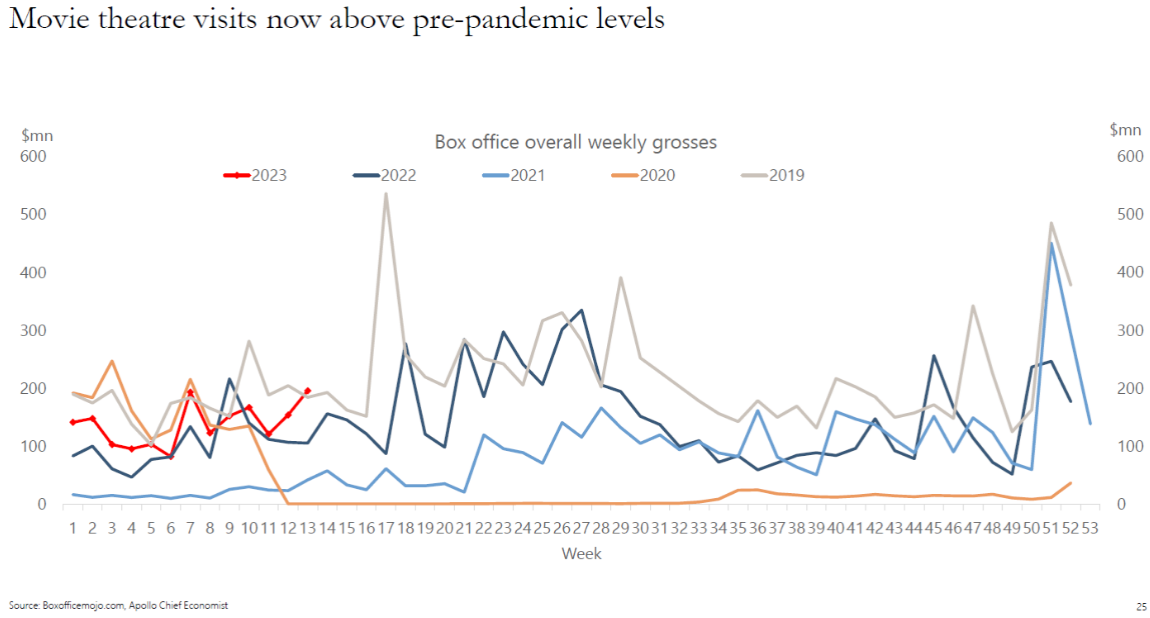
For the market as a whole, either bond yields calm down by settling at a higher level due to sustained inflation or they settle lower due to the economy slowing. Either way, we can expect an almighty reaction from stocks. The common link is that it would be sensible to brace for more equity volatility. — Isabelle Lee The strange patterns of market volatility, like so many other things, demonstrate how the effects of the pandemic are still working their way through the economy, making it far harder to discern underlying trends. Human nature, with Covid restrictions now more or less entirely lifted, is also making it harder to judge what is going on. The python is still digesting the pig. Jim Bianco of Bianco Research draws attention to this chart drawn up by Statista based on mobile data usage. It shows that as of last fall, a number of big American downtowns remained spectacularly less occupied than they had been in 2019, despite the end of all lockdowns, and great enthusiasm by employers to bring their workers back: The numbers, compiled by the University of Toronto School of Cities, show how regionally specific trends in working from home vary widely across regions. It was predictable that San Francisco, with it's tech-savvy workers, would see the greatest reduction in downtown activity. Was it quite so predictable that Boston and Chicago would see a far bigger hit to presence in downtowns than Los Angeles? Digging a bit further reveals that there are also important differences between countries. Google published mobility data during the pandemic, tracking where its users were and how patterns of usage differed from 2019. They discontinued the exercise in October, but all the data are still available from Our World In Data. The following chart shows the change in people's visits to their workplaces compared to the beginning of 2020 for the US and Germany. I took a 30-day moving average for the sake of legibility: 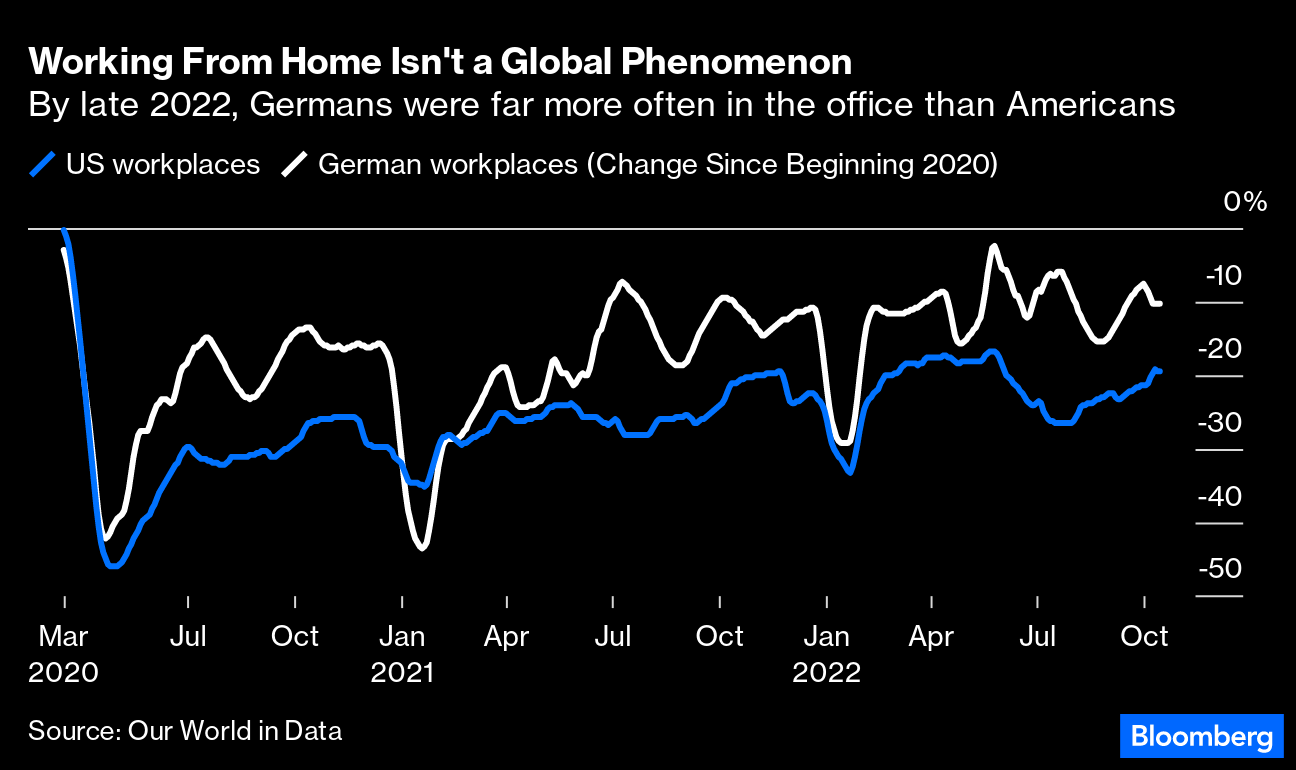 By last fall, then, Americans had settled into a pattern where they were significantly more likely to be working from home than Germans. Attendance in the office was down almost identically in the US and UK (19.1% and 19.8%, respectively). Sweden, the country that most famously eschewed lockdowns, still has workplace use almost 10% below 2019 — a bigger impact than in Germany. In another measure, Swedes' use of transit stations was still down 20% from 2019, a slightly greater reduction than in the US and the UK. At this point, the contentious arguments over legal restrictions matter far less than the different and unpredictable ways in which the pandemic changed habits in different countries. For numbers that are more up-to-date, Torsten Slok, chief economist at Apollo Global Management, offers the following chart, which confirms both a big variation between different American cities, and a stabilizing in the return to work, at much loser levels, since about half way through last year: The data is compiled by Kastle using security-card swipes. It's all explained here. Working from home, as far as white-collar American workers are concerned, seems to have become a habit. However, Slok also produces this chart to show that while people have decided it's no longer worth the hassle of going through a commute, the travel to go and see a movie in a cinema is well worth it. US box office receipts are now running slightly ahead of their level for the same week in 2019: I haven't checked cinema-ticket-price inflation, but I suspect the number of moviegoers is still lower than pre-pandemic. It's still startling that everyone's exposure to binge-watching and streaming services hasn't had too much of an effect on the desire to go to the movies. Just how the python of the global economy will digest the pig it ingested with the pandemic continues to be very, very hard to predict. Treat it as a kind of floating asterisk over any and all economic prognoses. It's time for a long read on the intersection of financial arbitrage theory and commodity markets with brand marketing and bad diets. My wife sent me this remarkable 2011 piece on how the McDonald's pork McRib sandwich can be regarded as a piece of arbitrage. Somehow she guessed that I would find it interesting. I commend it to all. Like Bloomberg's Points of Return? Subscribe for unlimited access to trusted, data-based journalism in 120 countries around the world and gain expert analysis from exclusive daily newsletters, The Bloomberg Open and The Bloomberg Close. More From Bloomberg Opinion: Want more Bloomberg Opinion? OPIN <GO>. Or you can subscribe to our daily newsletter. | 


No comments:
Post a Comment