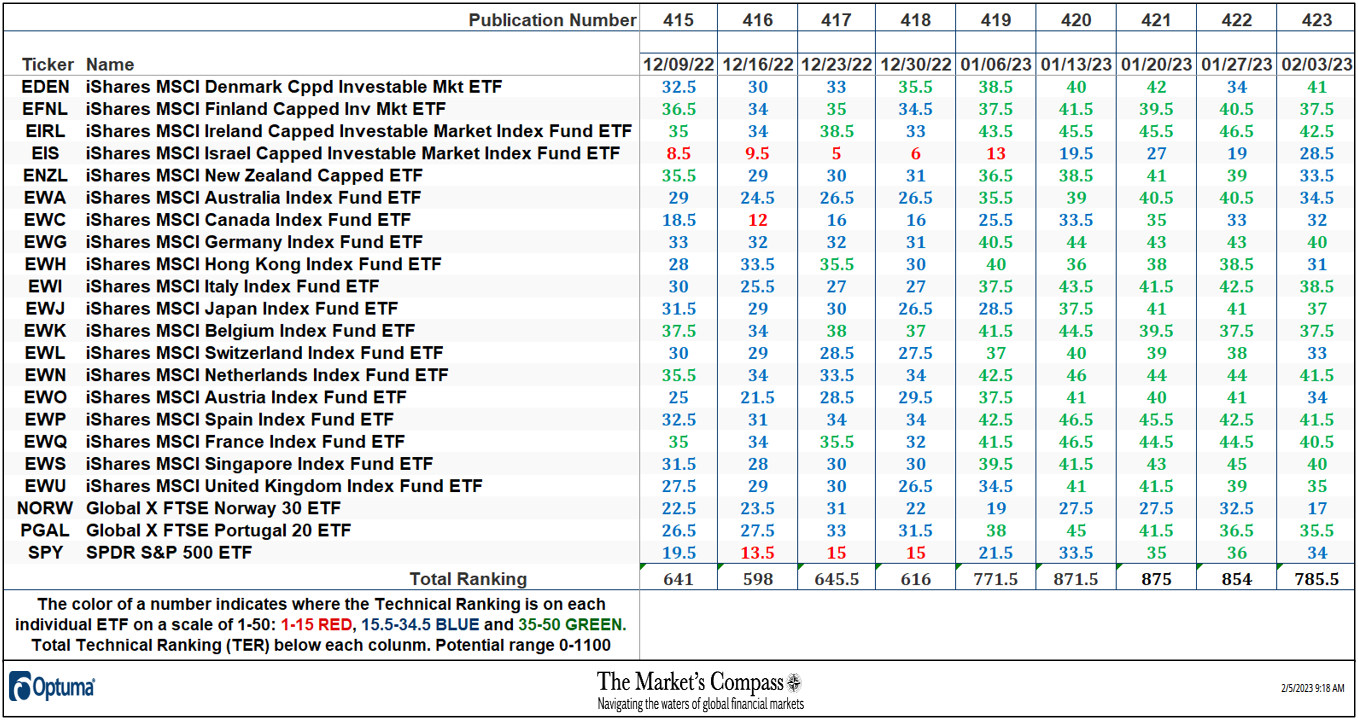
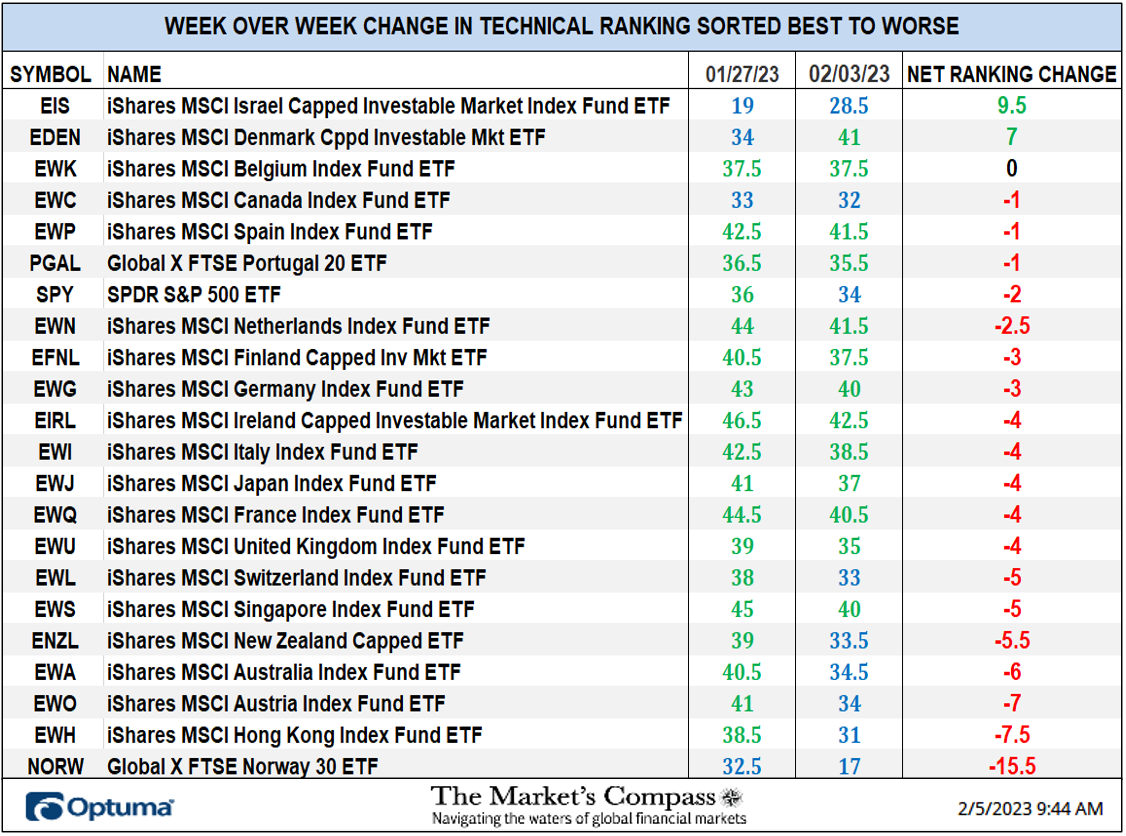
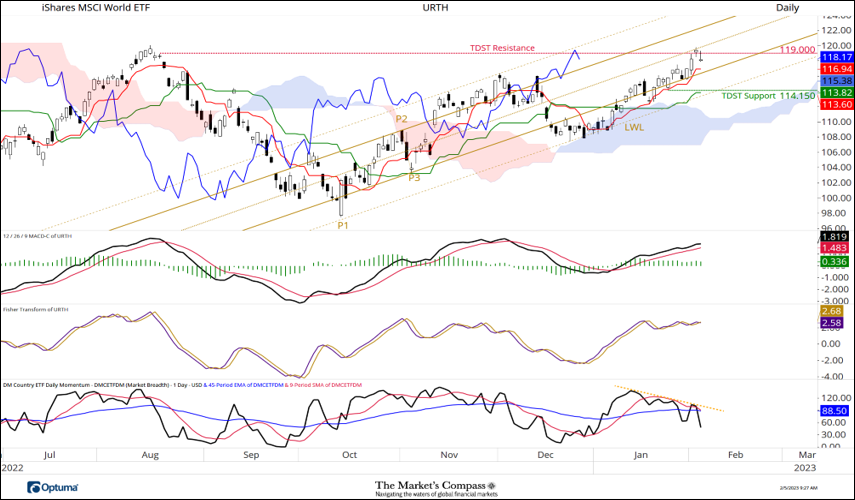
The Market’s Compass has returned with a new publication of the Market’s Compass Developed Markets Country (DMC) ETF Study. It continues to highlight the technical changes of the 22 DMC ETFs that we track on a weekly basis and share our technical opinion on, every three weeks. There are three ETF Studies that include the Market’s Compass US Index and Sector (USIS) ETF Study, the Developed Markets Country (DMC) ETF Study and the Emerging Markets Country (EMC) ETF Study. The three Studies will individually be published every three weeks and sent to paid subscriber's email. An excerpt will be sent to free subscribers. The EMC ETF Study will be published next week. This Week’s and 8 Week Trailing Technical Rankings of the 22 Individual ETFs The Excel spreadsheet below indicates the weekly change in the objective Technical Ranking (“TR”) of each individual ETF. The technical ranking or scoring system is an entirely quantitative approach that utilizes multiple technical considerations that include but are not limited to trend, momentum, measurements of accumulation/distribution and relative strength. If an individual ETFs technical condition improves the Technical Ranking (“TR”) rises and conversely if the technical condition continues to deteriorate the “TR” falls. The “TR” of each individual ETF ranges from 0 to 50. The primary take-away from this spread sheet should be the trend of the individual “TRs” either the continued improvement or deterioration, as well as a change in direction. Secondarily a very low ranking can signal an oversold condition and conversely a continued very high number can be viewed as an overbought condition but with due warning over sold conditions can continue at apace and overbought securities that have exhibited extraordinary momentum can easily become more overbought. A sustained trend change needs to unfold in the “TR” for it to be actionable. The improvement in individual TRs since the middle of December can easily be seen in the spread sheet above. This is where the “heat map” characteristic of the spread sheet best represents the TR improvements and deterioration of the technical condition of the individual Developed Markets Country ETFs and the WoW TR slippage in nearly all 22 ETFs can be seen below. At the end of last week, 19 DMC ETFs registered loses in their TRs and two ETF registered gains and one was unchanged. The Global X FTSE Norway 30 ETF (NORW) registered the largest drop in TR, falling -15.5 “handles” to 17 from 32.5. The NORW -2.42% decline last week was likely a knock on effect of a -7.75% decline in Brent Crude. The average TR loss was -3.11 “handles”. At the end of last week thirteen TRs were in the “green zone” (TRs between 35 and 50) and nine were in the “blue zone” (15.5 to 34.5). This was versus the week before when 18 ETFs had TRs in the “green zone”, 4 were in the “blue zone”. There has been continued improvement in the iShares Israel Capped Investable Market Index Fund (EIS) TR, up 9.5 to 28.5 from 19 after being as low as 5 near the end of December. Thoughts on the short-term technical condition of the URTH* *Of interest to scalpers, traders, and technicians Since I last published my thoughts on the short-term technical condition of the URTH, the ETF bounced back and forth, below and above the Lower Parallel (solid gold line) of the Schiff Pitchfork (gold P1 through P3) but avoided a touch of the Lower Warning Line (gold dashed line marked LWL) and held support the top of the Cloud and the Kijun Plot (green line). Over the last five trading days prices held support at the Lower Parallel and the Tenkan Plot Plot (solid red line). On Tuesday, the Median Line of the Pitchfork (dotted gold line) capped the latest move to new recovery highs. MACD reflects the continued upside price momentum but the oscillator has not confirmed the new price highs. Of additional technical concern is the non-confirmation and lower highs in the DM Country ETF Daily Momentum Oscillator (gold dashed line in the bottom panel). Both technical features suggest that more than Friday’s one day pullback is in the cards. Charts are courtesy of Optuma whose charting software enables anyone to visualize any data.. To receive a 30-day trial of Optuma charting software go to… To read the entire ETF Studies become a paid subscriber at $10 a month or $100 a year. Go to… |
Monday, February 6, 2023
The Market’s Compass Developed Markets Country ETF Study Excerpt
Subscribe to:
Post Comments (Atom)
This weight loss drug loophole is set to make investors incredibly wealthy.
This weight loss drug loophole ...

-
La minute d'inspiration de BE A BOSS pour les BOSS Pensez à ajouter cette adress...
-
La minute d'inspiration de BE A BOSS pour les BOSS Pensez à ajouter cette adress...
-
L'actualité des BeaBoss chaque jour Pensez à ajouter cette adresse à votre carnet...


No comments:
Post a Comment