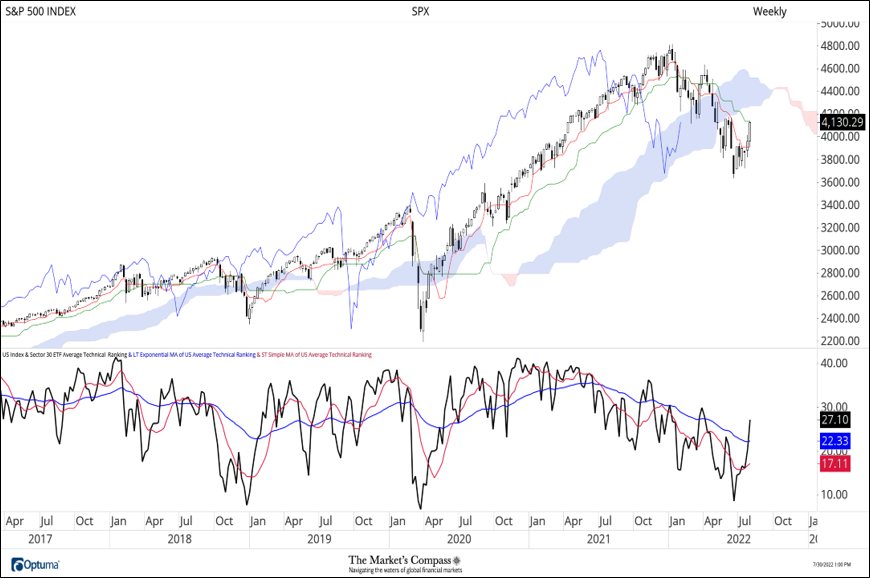
The Average Technical Ranking of the 30 US Index and Sector ETFs The weekly Average Technical Ranking (“ATR”) is the average Technical Ranking or TR of the 30 individual US Index and Sector ETFs we track that ranges between 0-50. Like the TER, it is a confirmation/divergence or overbought/oversold indicator.
After reaching a deep oversold ATR reading of 8.57 at the end of the on June 17th the ATR has risen to 27.10 and although it has surpassed both it shorter-term and longer-term moving averages it has yet to reach and overtake the March 25th reading of 29.95. Prices remain capped by the Kijun Plot (green line) which is the mid-point of the 26-week range and have not yet challenged Cloud resistance. To recieve the entire blog post become a paid subscriber. Go to…
© 2022 The Market's Compass
|
Monday, August 1, 2022
The Market’s Compass US Index and Sector ETF Study Excerpt
Subscribe to:
Post Comments (Atom)
The Math Most Traders Skip
How to know whether you can take a trade before you get in ͏ ͏ ͏ ͏ ͏ ͏ ͏ ͏ ͏ ͏ ͏ ͏ ͏ ͏ ͏ ͏ ͏ ͏ ͏ ͏ ͏ ͏ ͏ ͏ ͏ ͏ ͏...
-
PLUS: Dogecoin scores first official ETP ...
-
Bloomberg Evening Briefing Americas View in browser Who's paying for Donald Trum...


No comments:
Post a Comment