Welcome to The Market’s Compass Emerging Market’s Country ETF Study, Week #579. As always, it highlights the technical changes of the 20 EM Country ETFs that I track on a weekly basis and publish every third week. Paid subscribers will receive this week’s unabridged Emerging Market’s Country ETF Study sent to their registered e-mail. Past publications can be accessed by paid subscribers via The Market’s Compass Substack Blog. Next week I will be publishing The Market’s Compass Developed Markets Country ETF Study. On Sunday I published the latest edition of The Market’s Compass Crypto Sweet Sixteen Study which I publish on a weekly basis and tracks the technical changes of sixteen of the larger capitalized Cryptocurrencies. This morning’s Market’s Compass Emerging Markets Country ETF Study is being sent to free subscribers as well as my regular paid subscribers in a not so vailed attempt to lure free subscribers to support the work done in the three ETF Studies and the Weekly Crypto Sweet Sixteen Studies. This Week’s and 8 Week Trailing Technical Rankings of the 20 Individual EM Country ETFsTo understand the methodology used in constructing the objective EM Country ETF Individual Technical Rankings visit the mc’s technical indicators page at www.themarketscompass.com and select “em country etfs”. What follows is a Cliff Notes version* of the full explanation of the methodology I use… *The technical ranking system is a quantitative approach that utilizes multiple technical considerations that include but are not limited to trend, momentum, measurements of accumulation/distribution and relative strength of each individual 20 EM Country ETFs that can range between 0 and 50. The Total EM Technical Ranking or “TEMTR” is the sum of the twenty individual TRs and can be viewed as an overbought / oversold indicator as well as a confirmation / non-confirmation indicator. There is also a Total Ranking for each geographic region that can be viewed as a relative measurement on a week over week basis.
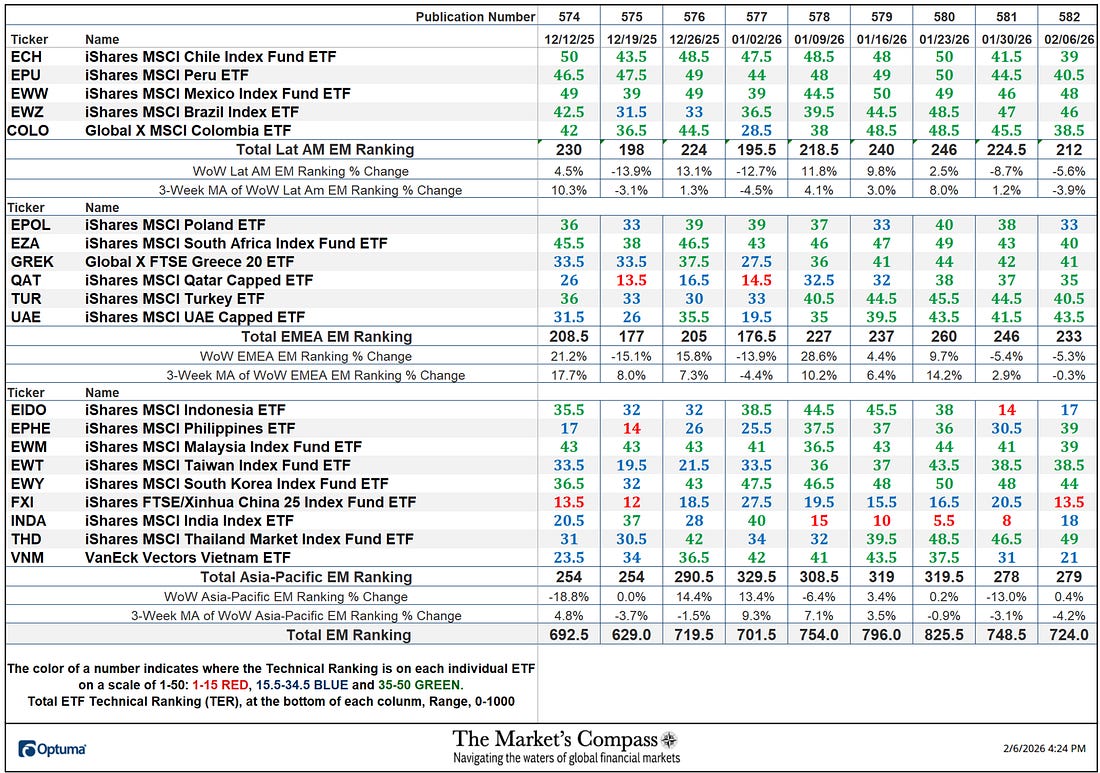
This past week The Total EM Technical Ranking or “TEMTR” fell -3.27% to 724 from 748.5 the previous week which was down from the 825.5 reading three weeks ago for the week ending 2/23, which was the highest “TEMTR” since January 2021. The Total Lat Am EM Ranking fell the most of the three geographic regions, down -5.6% to 212 from 224.5 the week before. The Total EMEA EM Ranking fell -5.3% to 233 from 246. The Total Asia-Pacific EM Ranking rose slightly, up 0.4% to 279 from 278 the previous week.
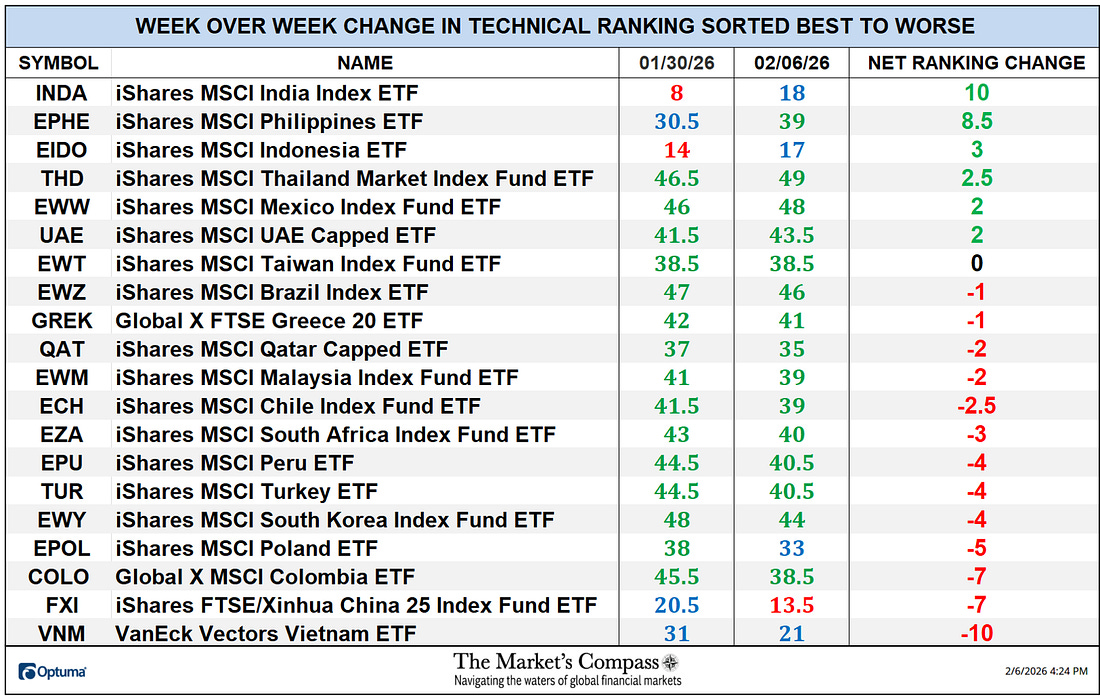
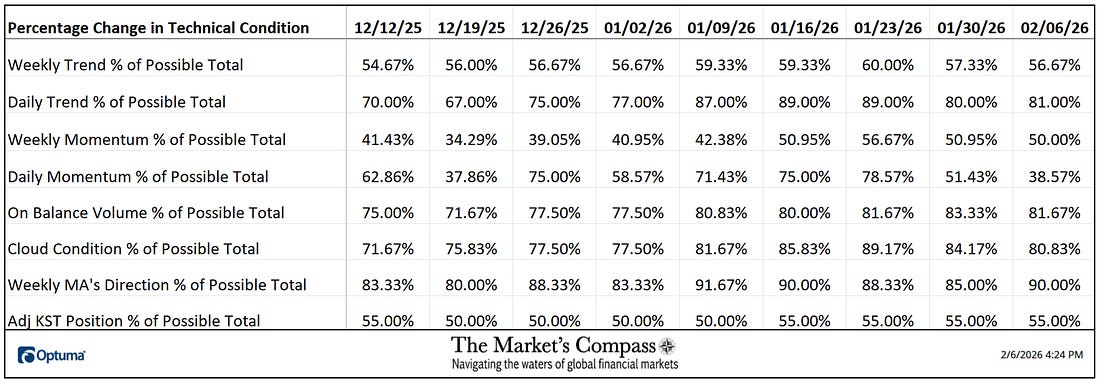
Six of the twenty EM Country ETFs I track in these pages registered a gain in their Technical Rankings or TRs over the past week; one was unchanged and thirteen had TRs that fell. Last week fifteen TRs were in the “green zone” (TRs between 34.5 and 50), four were in the “blue zone” (TRs between 15.5 and 34), and two were in the “red zone” (TRs between 0 and 15). The average TR loss was -1.23 vs the average TR loss the previous week of -3.85 when only two TRs rose and 18 moved lower. For the week ending 2/23, eighteen of the EM Country ETF TRs ended the week in the “green zone”, one was in the “blue zone”, and one was in the “red zone”. The Technical Condition Factor changes over the past week and previous 8 weeks*To understand the construction the of The Technical Condition Factors visit the Market’s Compass website www.themarketscompass.com and go to the mc’s technical indicators page and select “em country etfs”. A short version of the how the Technical Condition Factors are calculated follows… There are eight Technical Condition Factors (“TCFs”) that are a summation of the twenty ETFs TRs technical condition of each TCF question. The eight Technical Condition Factors do not ask the same number of questions. That is why it is calculated as a percentage. If a TCF individual reading is 100% that would mean that all Twenty ETFs fullfilled that particular TCF criterior.
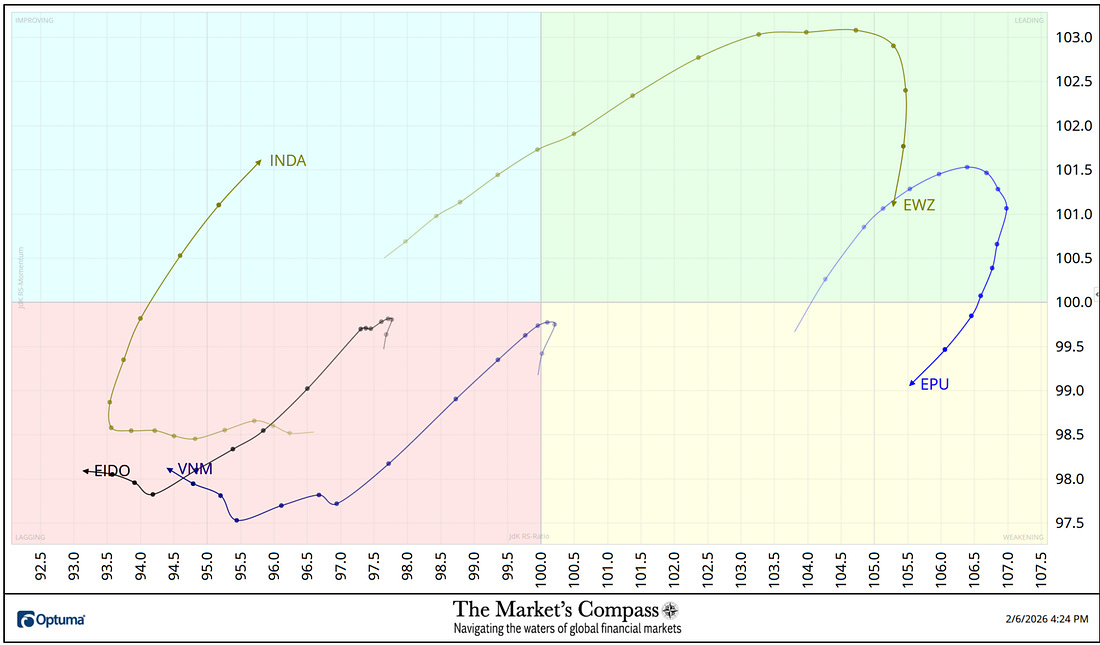
This past week a reading of 38.57% was registered in the Daily Momentum Technical Condition Factor (”DMTCF”) or 54 out of a possible total of 140 positive points. As a confirmation tool, if all eight TCFs improve on a week-over-week basis, more of the 20 ETFs are improving internally on a technical basis, confirming a broader market move higher (think of an advance/decline calculation). Conversely if all eight TCFs fall on a week-over-week basis it confirms a broader market move lower. Last week, two TCFs rose, five fell, and one was unchanged. Relative Strength and Weakness in the Emerging Markets ETFs vs. the EEM utilizing a Relative Rotation GraphThe Relative Rotation Graph, commonly referred to as RRGs were developed in 2004-2005 by Julius de Kempenaer. These charts are a unique visualization tool for relative strength analysis. Chartists can use RRGs to analyze the relative strength trends of several securities against a common benchmark, (in this case the EEM) and against each other over any given time period (in the case below, daily) over the past three weeks. The power of RRG is its ability to plot relative performance on one graph and show true rotation. All RRGs charts use four quadrants to define the four phases of a relative trend. The Optuma RRG charts uses, From Leading (in green) to Weakening (in yellow) to Lagging (in pink) to Improving (in blue) and back to Leading (in green). True rotations can be seen as securities move from one quadrant to the other over time. This is only a brief explanation of how to interpret RRG charts. To learn more, see the post scripts and links at the end of this Blog. Not all 20 ETFs are plotted in this RRG Chart. I have done this for clarity purposes. Those which I believe are of higher technical interest remain.
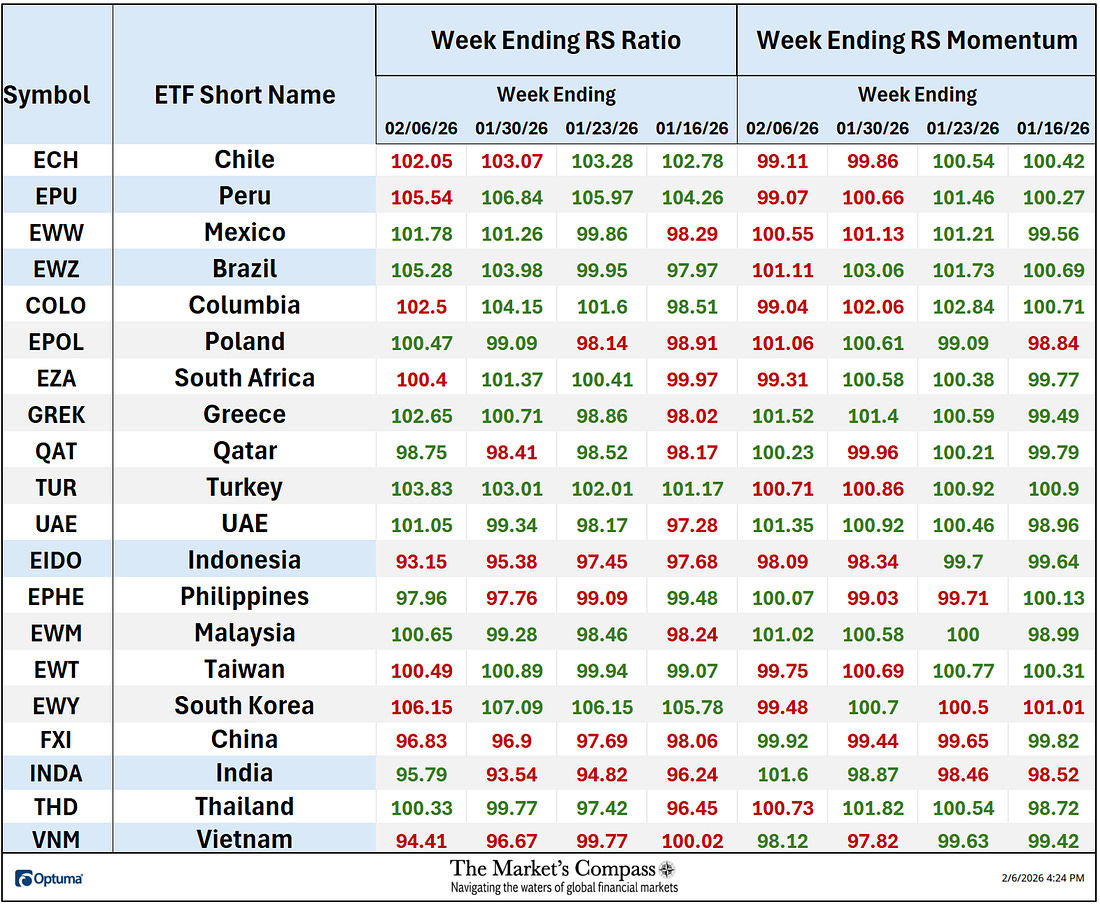
After weeks of improving Relative Strength and Relative Strength Momentum both the iShares MSCI Brazil Index ETF (EWZ) the iShares MSCI Peru ETF (EPU) rolled over in the Leading Quadrant with EPU leading the charge lower but as can be seen in the Tabulation Table below the EPU still sports the best Relative Strength vs. the EEM despite the contraction in both Relative Strength and Momentum even with the fact that it has entered the Weakening Quadrant. At the start of the year the iShares MSCI India Index Fund ETF (INDA) fell into the Lagging Quadrant and struggled there until a week ago last Friday when it hooked higher and moved into the Improving Quadrant exhibiting impressive Relative Strength Momentum toward the end of week (note the distance between the daily nodes). Both the VanEck Vectors Vietnam ETF (VNM) and the iShares Indonesia ETF (EIDO) fell deeper in the Lagging Quadrant until both began to stabilize and hook higher last week. The Emerging Markets Country ETF Relative Strength and Relative Strength Momentum Tabulation Table.The “Tabulation Table” below marks the Relative Strength and Relative Strength Momentum readings vs. the iShares MSCI Emerging Markets Index ETF or EEM. It begins with the readings at the end of last week followed by the trailing three weeks that includes the readings from the last Study for the week ending 1/16. If there has been an improvement in either the Relative Strength Ratio or the Relative Strength Momentum reading on a week-over-week basis I have highlighted it in green. If there has been a contraction in either, it is highlighted in red and an unchanged reading in either will remain black. The color-coding system serves as a heat map over the past four Friday’s readings highlighting either the continued improvement, deterioration, or stasis vs. the benchmark, the EEM. The ETFs that are displayed on the RRG chart above are highlighted in blue.
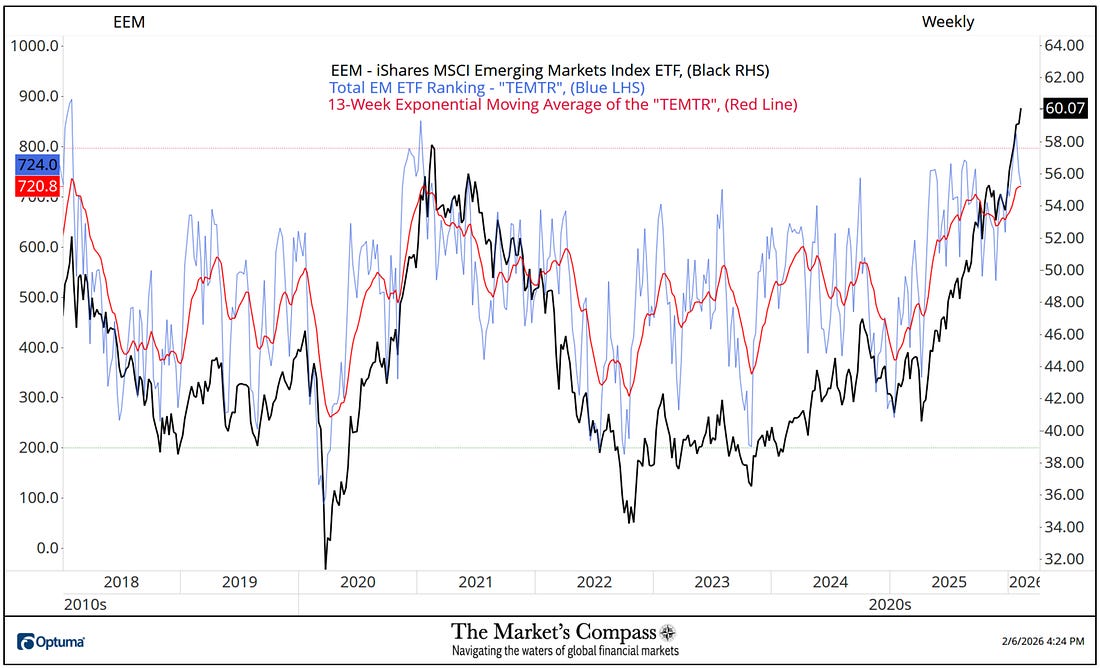
The EEM with the Total EM ETF Technical Ranking“TEMTR” Overlaid**The “TEMTR” is the sum of the 20 Individual Objective EM ETF Technical Rankings. It serves as an overbought or oversold as well as a confirmation / non-confirmation indicator.
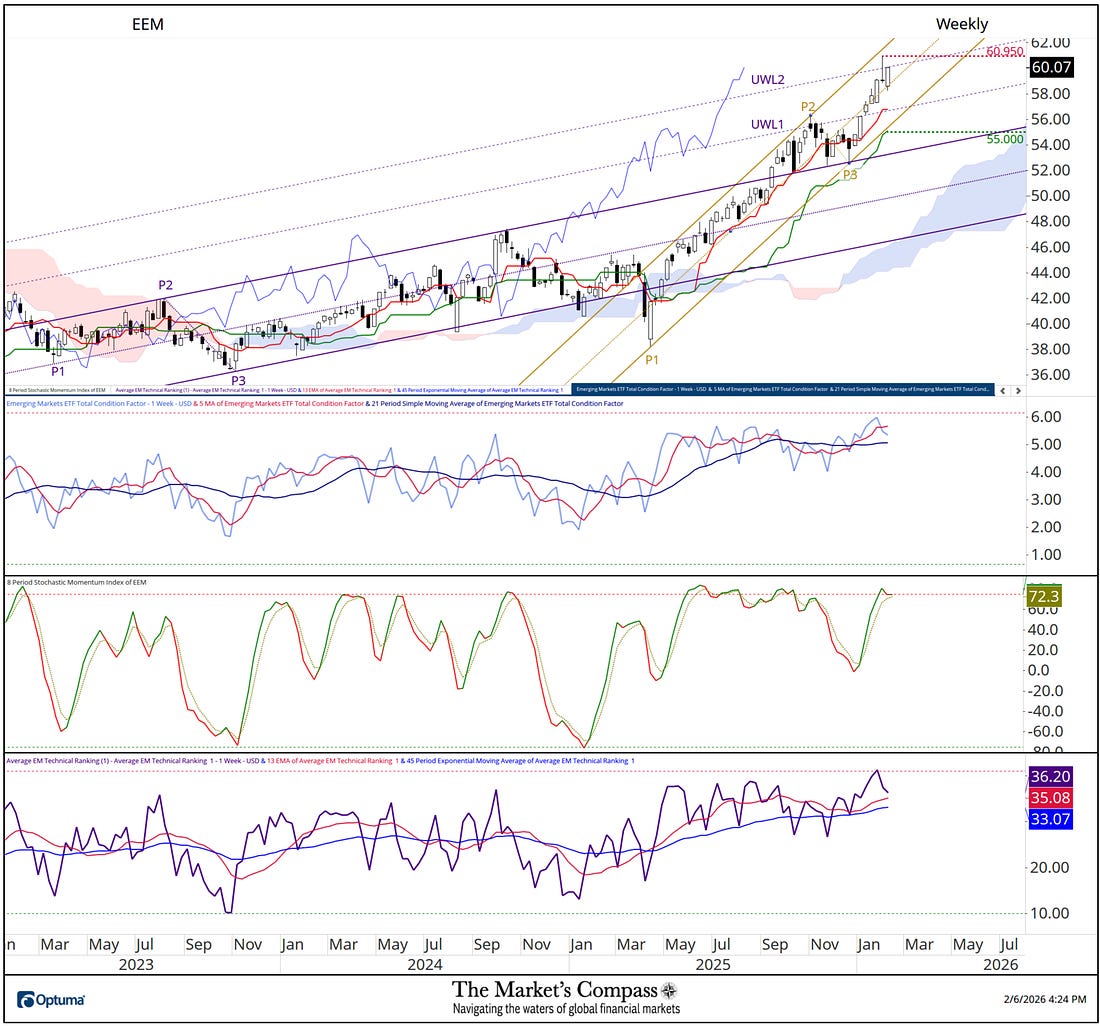
The EEM closed the week at a new weekly closing price high at 60.07 but as will be seen in the shorter-term Weeky Candle Chart and Daily Candle Chart that follow, the longer-term Weekly close Line Chart above does not tell a full price action picture. One thing that can be seen above, after the TEMTR confirmed the new closing price highs it has pulled back from overbought territory and at the end of last week it was testing support at the still rising 13-Week Exponential Moving Average of the TEMTR (red line). Nonetheless the Moving Average is still rising. More details to follow… The Weekly Candlestick and Cloud Chart of the EEM with the Average EM ETF Technical Ranking (“ATR”)* of the 20 EM ETFs and Weekly Momentum Oscillators*The “ATR” like the “TEMTR” serves as an overbought or oversold as well as a confirmation / non-confirmation indicator.
As I pointed out in comments on the Weekly Line Chart, two weeks ago the EEM rose to an all-time intra-week high at 60.95 but failed to hold above Upper Warning Line 2 (violet dotted line) of the longer-term Standard Pitchfork (violet P1-P3) and prices closed near the at the lows of the week. Last week prices opened lower but reversed and advanced back above the Median Line (gold dotted line) of the shorter-term Schiff Modified Pitchfork (gold dotted line) but was capped at the UWL2 at the close of the week. The Emerging Markets Total Condition Factor Oscillator has pulled back for the second week in a row from overbought territory and has fallen below the 5-Week Movin Average (red line) The Average EM Technical Ranking (bottom panel) has done the same although it remains above both Moving Averages. Learn about Pitchforks and their applacation in the three-part Pitchfork tutorial in the Market’s Compass website, www.themarketscompass.com More on the technical condition of the EEM in Thoughts on the Short-Term Technical Condition of the EEM but first… The EM Country ETFs Weekly Absolute and Relative Price % Change**Does not include dividends if any. Fourteen of the twenty EM Country ETFs were up on an absolute basis last week; one was unchanged and five traded lower over the week. Ten EM ETFs outperformed the +1.64% gain in the EEM on a relative basis and ten underperformed. The average five-day absolute gain in the EM ETFs was +1.40% vs. a +1.64% gain in the EEM. The previous week the average absolute loss was -0.47% vs. de minimis +0.05 gain in the EEM. Thoughts on the Short-Term Technical Condition of the EEM
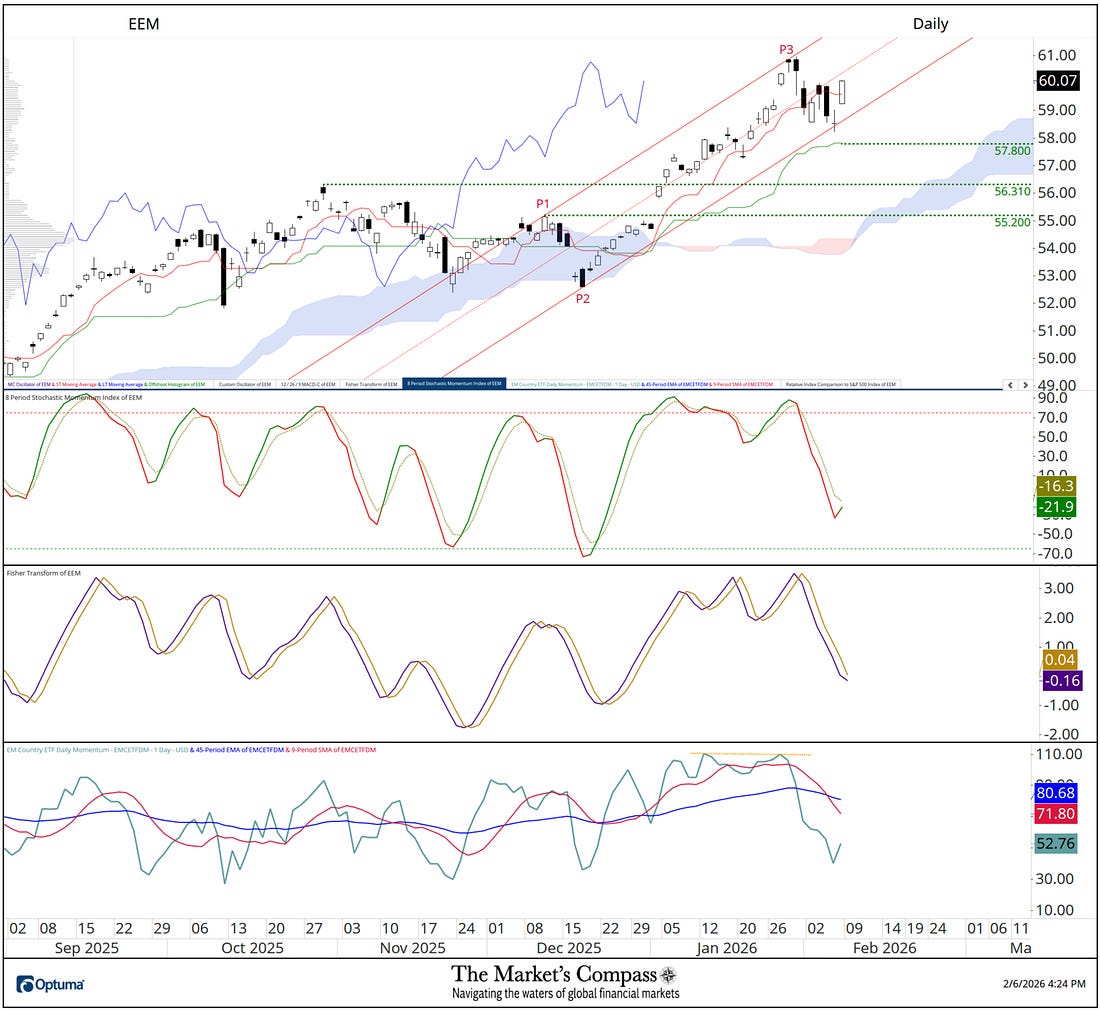
In the previous Emerging Markets Country ETF Study (published on January 19th), I suggested that “a retracement is forthcoming in the short term which is hardly a surprise considering how stretched the EEM has become”. That technical thesis proved to be premature and the EEM rallied to new highs but a week ago, last Thursday the chickens finally came home to roost. When it became evident that the retracement was unfolding last last week I added a new Schiff Modified Pitchfork (red P1 through P3). The EM Country ETF Daily Momentum / Breadth Oscillator failed to confirm the highs at P3 (yellow dashed line in the lower panel) giving me confidence that the backing and filling was about to unfold. Last Thursday the Lower Parallel (solid red line) offered a measure of price support leading to Friday’s rally. That rally led to a slowing of the decline in both the Stochastic Momentum Index and the Fisher Transform* although both remain below their signal lines. Only a follow through to Friday’s price rally through the Median Line (red dotted line) of the newly drawn Pitchfork would suggest that the price pullback may have run its course. Key word “may”. *The Fisher Transform is a technical analysis indicator used to identify potential price reversal by transforming price data into a Gaussian normal distribution and was developed by John Ehlers. You're currently a free subscriber to The Market's Compass Technical View. For the full experience, upgrade your subscription.
|
Monday, February 9, 2026
The Market's Compass Emerging Markets Country ETF Study
Subscribe to:
Post Comments (Atom)
FORGET Software - These Sectors Are Soaring!
Hedge funds have already made over $24 billion shorting software stocks in 2026 — and they're doubling down. The smart money isn't...
-
PLUS: Dogecoin scores first official ETP ...
-
Hollywood is often political View in browser The Academy Awards ceremony is on Sunday night, and i...


No comments:
Post a Comment