|
|
Big Bet Against GOOGL |
By Brandon Chapman, CMT |
Google closed yesterday at $177. |
Yesterday at 10:52 AM, someone spent $1.4 million on a single trade. 10,000 put contracts at the $160 strike, expiring January 23rd. All bought at the ask price. |
|
And the Ghost Prints Console picked it up as it happened. |
That's not hedging. That's directional conviction timed to year-end events. |
Let's look at a trade that allows you to profit from this conviction. |
The Volatility Warning That Confirms The Setup |
The three-month VIX futures are trading 20% above spot VIX right now. This measure is something I call the 90-day Rubber Band. |
That ratio hasn't held above 1.2 this long without consequence. It means institutions expect turbulence within 90 days, and they're positioning now while protection remains cheap. |
This volatility signal matters for Google because it shows the smart money is preparing for the same year-end turbulence that the $1.4 million GOOGL bet anticipates. Before the inflation print. Before the BOJ meeting. Before year-end posit |
Why The Semiconductor Weakness Spreads to Google |
The semiconductor contagion started weeks ago and it's now reaching cloud infrastructure stocks. Here's the connection. |
Semiconductors lead technology. When chips weaken, cloud infrastructure questions follow. |
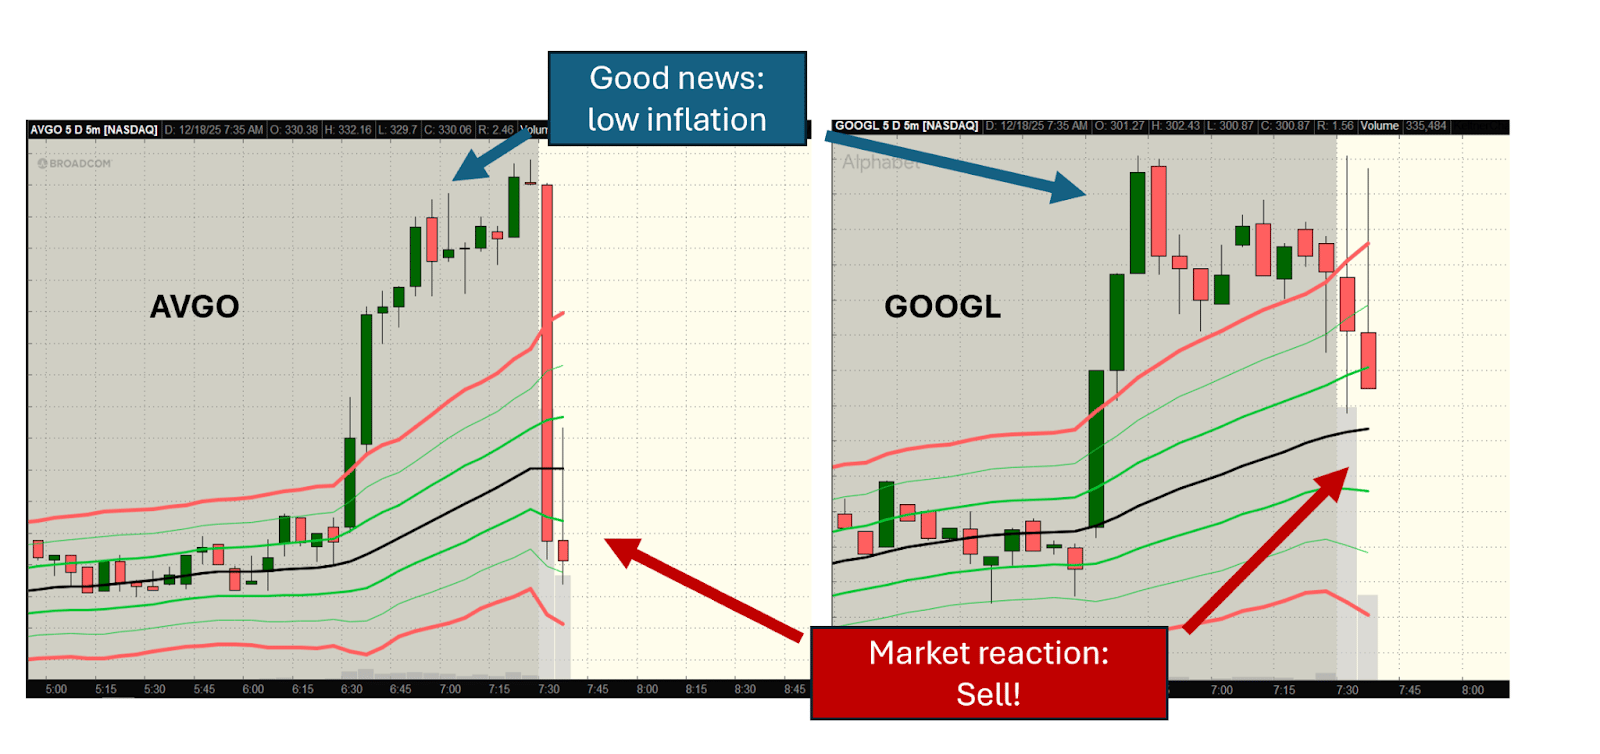
Google competes directly in AI spending with Microsoft and Meta. When Broadcom (AVGO) cuts guidance on data center buildouts, investors start asking whether Google's capex plans make sense. Taiwan Semi bought deep out-of-the-money puts before its breakdown. Oracle gapped down 4.5% after earnings on infrastructure concerns. |
Even after Micron (MU) blew past expectations and issued strong upward guidance, even after the inflation data came in significantly lower than expected, the market greeted this news with a waterfall of red candles. |
|
This pattern is now showing up in Google's options flow. The $260 strike sits 10% below current price. As Google drifts toward that level, delta increases and hedging requirements grow. Market makers short more stock. |
That's gamma. It doesn't predict the move. It amplifies whatever move starts. |
The Trade Structure That Captures This Setup |
A bearish put spread on Google captures 5-8% downside without requiring catastrophic moves. Here's the structure: |
|
Maximum risk is the debit paid. Maximum profit is the $10 spread width minus that debit. |
Target 70% of max profit, which typically hits on a move to $168-170. |
Why Now |
The 90-day volatility comparison says now is the time. VIX3M trading 20% above spot VIX means volatility is expected to rise. |
Buying puts gets more expensive tomorrow than today. Lock in your position while premiums remain reasonable. |
The year-end setup favors caution. Multiple weeks closing above expected move creates statistical anomalies. We saw this pattern in JETS before recent weakness. Three consecutive weeks above the one-standard-deviation band, then mean reversion kicked in. |
When you combine the $1.4 million bearish print with the 90-day volatility warning, the semiconductor contagion pattern, and binary events this week, the bearish put spread becomes obvious. |
You're not predicting disaster. You're positioning for normal reversion in an environment where asymmetric risk favors downside. |
Where volatility expectations point to turbulence ahead. Where institutional flows show defensive positioning building. |
The Ghost Prints Console caught this trade as it hit the tape. Members saw the size. The fill at the ask. The strike selection indicating directional intent rather than protective hedging. |
These signals don't appear on charts. Volume spikes don't reveal whether institutions are buying or selling. |
Price action doesn't show you positioning ahead of catalysts. |
The prints show you what's building. The volatility curve gives you timing. |
The only question is whether you position before the move or explain afterward why you missed it. |
Brandon Chapman, CMT
Creator of Ghost Prints |


No comments:
Post a Comment