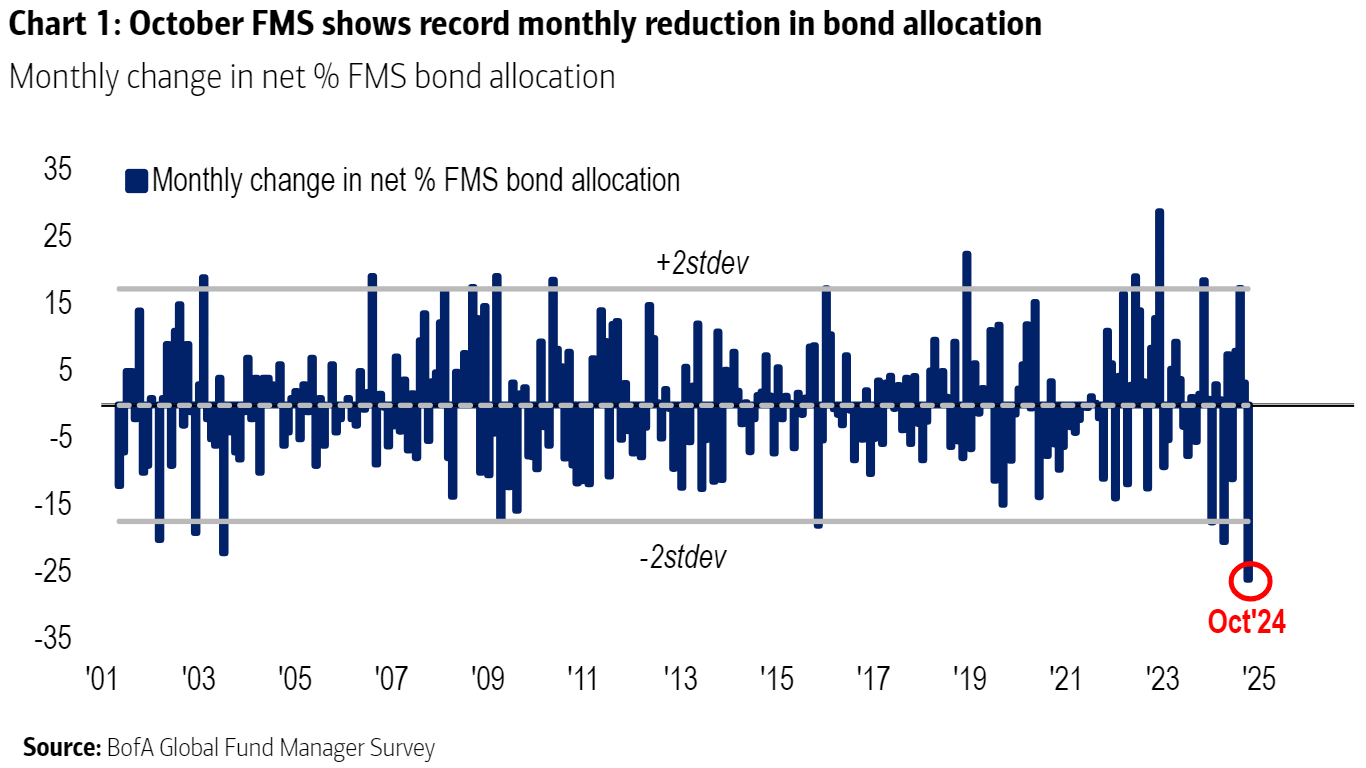
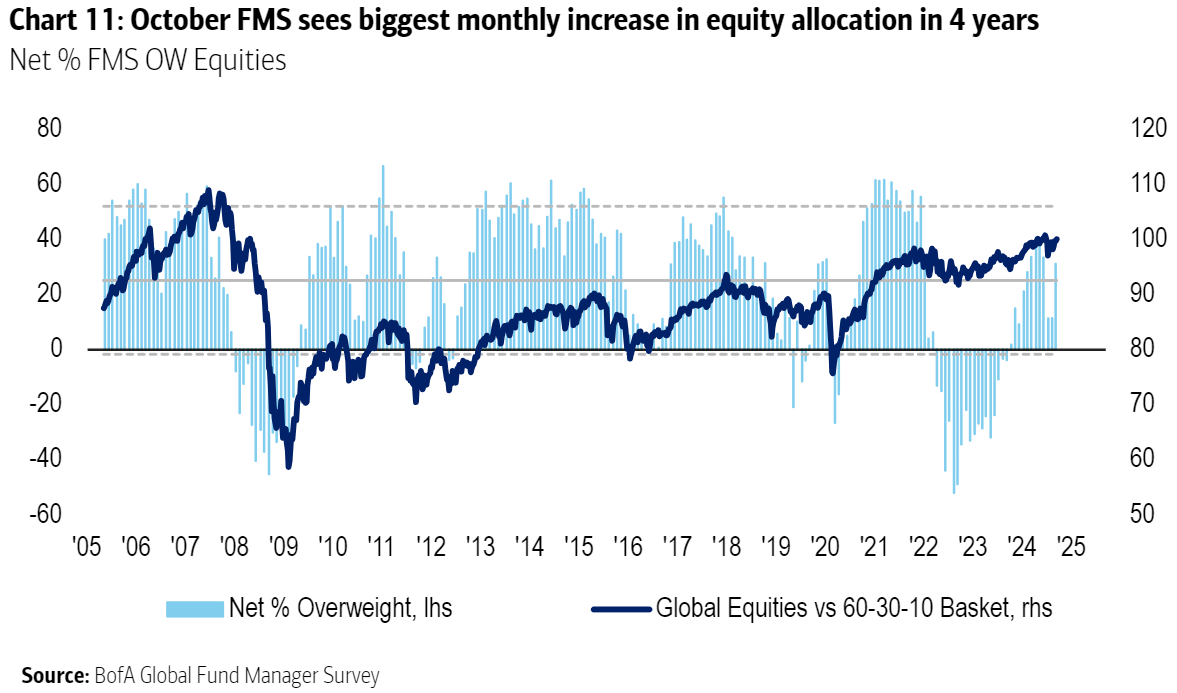
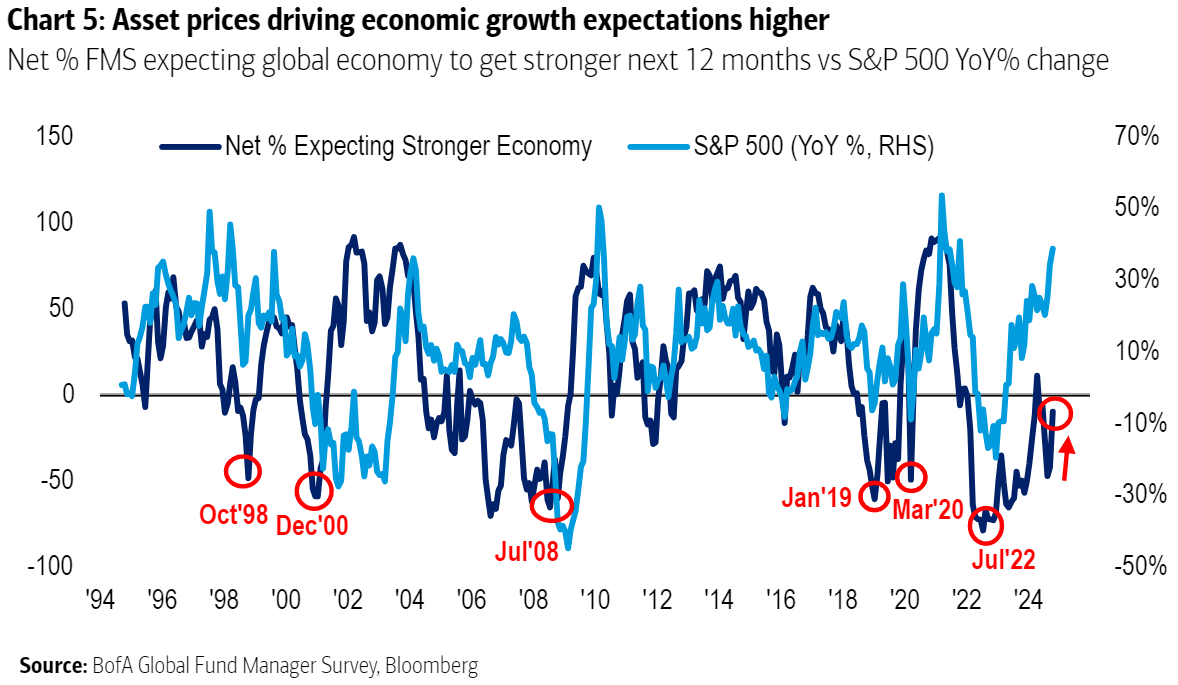
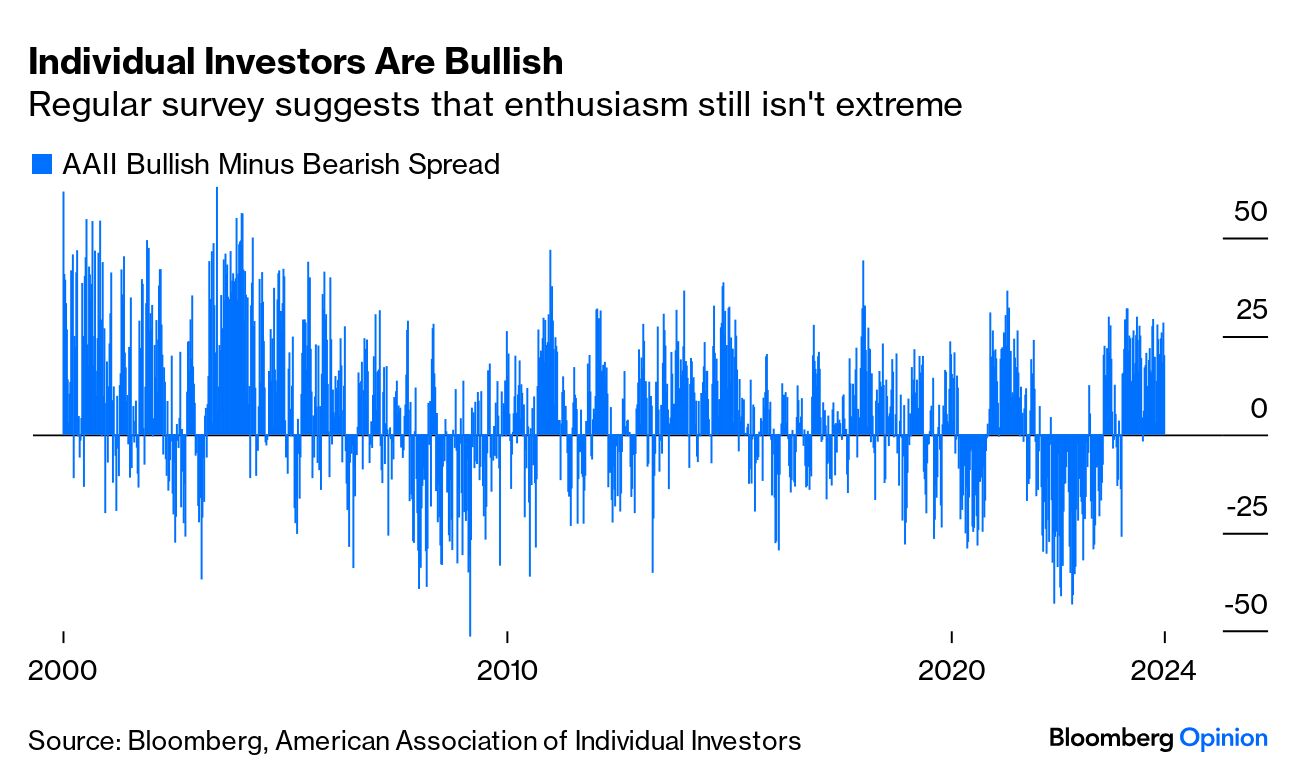
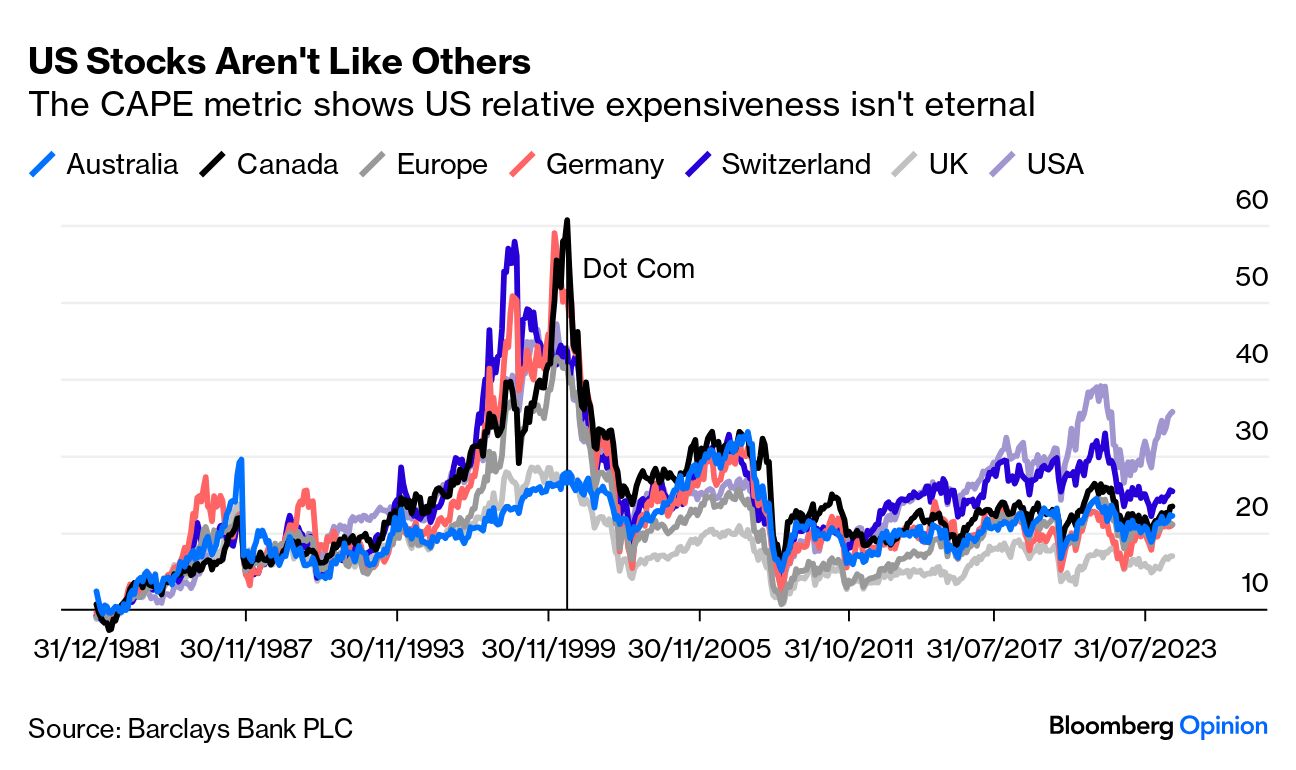
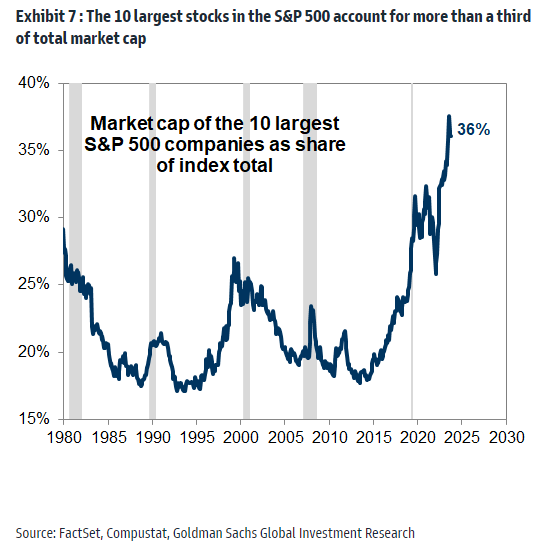
| Even the bulls were wrong about 2024. The S&P 500 closed the week at yet another record, and it's now up 23% for the year. Wall Street has institutional reasons to be bullish, but even sell-side strategists have been surprised. This is how it's moved, along with the average prediction for year-end, as compiled by Bloomberg colleague Lu Wang. In January, strategists expected the world's most tracked index to be flat for the year. They've raised their estimates again and again, and the S&P 500 has outpaced them: 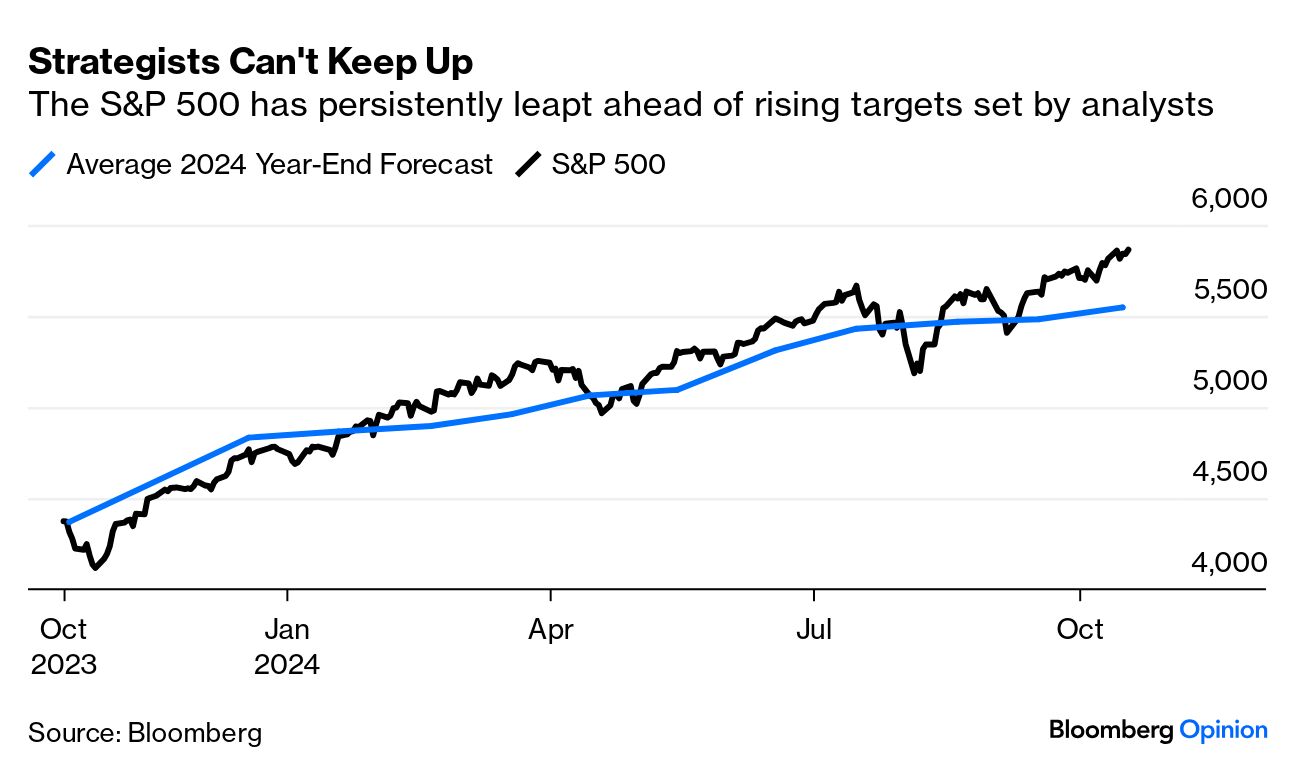 Some of this is explicable in terms of the economy. The jobs market has held up much better than expected, while inflation appears to be beaten. Rates are high, but declining. All the gains from artifical intelligence, we now know, weren't yet in the price in January. But the political uncertainties are well known, and reliable long-term metrics suggest extreme caution. So what's going on? And how exactly do you deal with a situation that looks set fair in the short term (give or take the outside risk of World War III) but unfavorable in the longer term? Wall Street is trying. One of its most prominent figures, Goldman Sachs Group Inc.'s chief US equity strategist David Kostin, has published a remarkable double. On Oct. 4, he raised his year-end S&P forecast from 5,600 to 6,000, with a 12-month target of 6,300. That's about 11% over a year. Last week, he published a follow-up paper suggesting that the index will gain only 3% in nominal terms (1% in real terms) per year over the next decade — which would be one of the worst on record. This is despite a headstart of 10% in the next 12 months. Contrary to initial impression, this isn't totally contradictory. Indeed, it makes sense. But to predict simultaneously that an already strong market will have a great next 12 months and a poor next 10 years does imply an untenable spot, or even, conceivably, a bubble. Let's go through the main drivers in order. In the short term, markets are creatures of what Keynes called animal spirits. Things are moving emphatically in a bullish direction, making it hard to stand in the way in the short term. The big global money managers polled by Bank of America Corp. last month made the biggest cut to bond allocations in the 23 years of the survey: The excitement about equities is palpable, with the biggest increase in allocations since the market began to emerge from the first pandemic lockdowns in 2020: The strength of the stock market tends to drive a positive feedback loop on the economy. Optimism that it will continue to grow over the next 12 months has intensified as the S&P 500 rallied on: All of this is consistent with markets' growing belief that Donald Trump will regain the White House. That, it's believed, would be good for stocks and bad for bonds. Politics might also explain the current positivity in sentiment recorded faithfully by the American Association of Individual Investors. This is the spread of those describing themselves as bulls over those who are bearish: The record low reading came in the week of March 2009, when stocks bottomed after the Global Financial Crisis, and the next lowest came as stocks turned upward in September 2022. Extreme negativity can be a useful timing tool. Strong positivity, as now, isn't so predictive. The bulls have had the upper hand at one or two great times to sell, but also through plenty of periods when the market did well. Earnings season, another big short-term factor, also counsels against getting out. Earnings forecasts are relatively unchallenging, while Kostin's team estimates that profit margins can continue to expand. Goldman also expects slightly better things of the economy than the consensus does, which would also justify strength for the next year. For the long term, scarcely anything matters other than valuation. The more expensive a stock when you buy it, the less of a return you're likely to get for it over a decade or more. This relationship doesn't hold at all in the short term, and you can't use it for market-timing. An irrationally expensive market can always get more expensive. But over periods of a decade or more, it's startlingly strong. This is at the center of the rather bearish longer-term call by Goldman (and by others). The most widely followed measure of long-term value is the CAPE (Cyclically Adjusted Price/Earnings multiple), first put forward by the legendary value investor Benjamin Graham in the 1930s, and made popular by the Yale University Nobel laureate Robert Shiller in his book Irrational Exuberance 25 years ago. I've written about this very often. The key point is that valuations adjust for the economic cycle; multiples will be higher when times are bad but likely to improve, and vice versa. To correct for this, it compares current prices to average earnings for the previous 10 years, adjusted for inflation. Shiller calculated the CAPE back to the 19th century (all data is from his website): 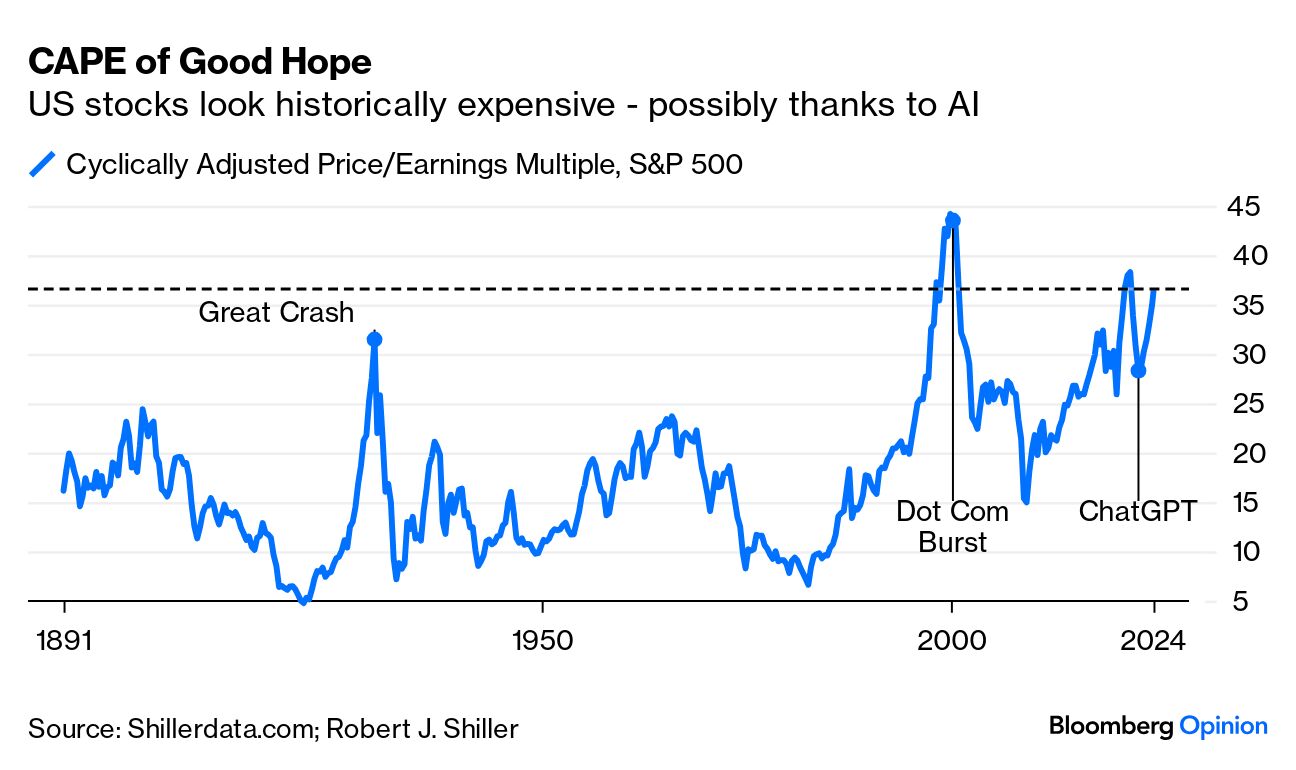 There are reasons why the CAPE would rise over time, as profitability and productivity grow. But it's disconcerting that the S&P is more expensive than on the eve of the Great Crash in 1929, and not much cheaper than when the dot-com bubble burst in early 2000. Perhaps more importantly, after the CAPE made big peaks in the past, it descended dramatically for a number of years. Not so this time, with CAPE peaking in the 2021 post-Covid boom, but bouncing late in 2022. Coincidentally or not, that bounce coincided exactly with the launch of ChatGPT. The AI boom seems to be performing a Herculean task in keeping the market high. Stock valuations shouldn't be viewed in isolation from bonds. Lower bond yields justify paying more for stocks. The following chart shows Shiller's "Excess CAPE Yield," which subtracts the 10-year Treasury yield from the CAPE Yield (the inverse of the main metric). The chart compares this yield with subsequent 10-year performance of stocks compared to bonds. The lower the excess yield you get from stocks, the less well they do subsequently relative to bonds. The two times when the Excess CAPE Yield went negative (meaning that stocks were more expensive than bonds) overlapped exactly with the Great Crash and the dot-com bubble, history's best two opportunities to get out of the stock market: 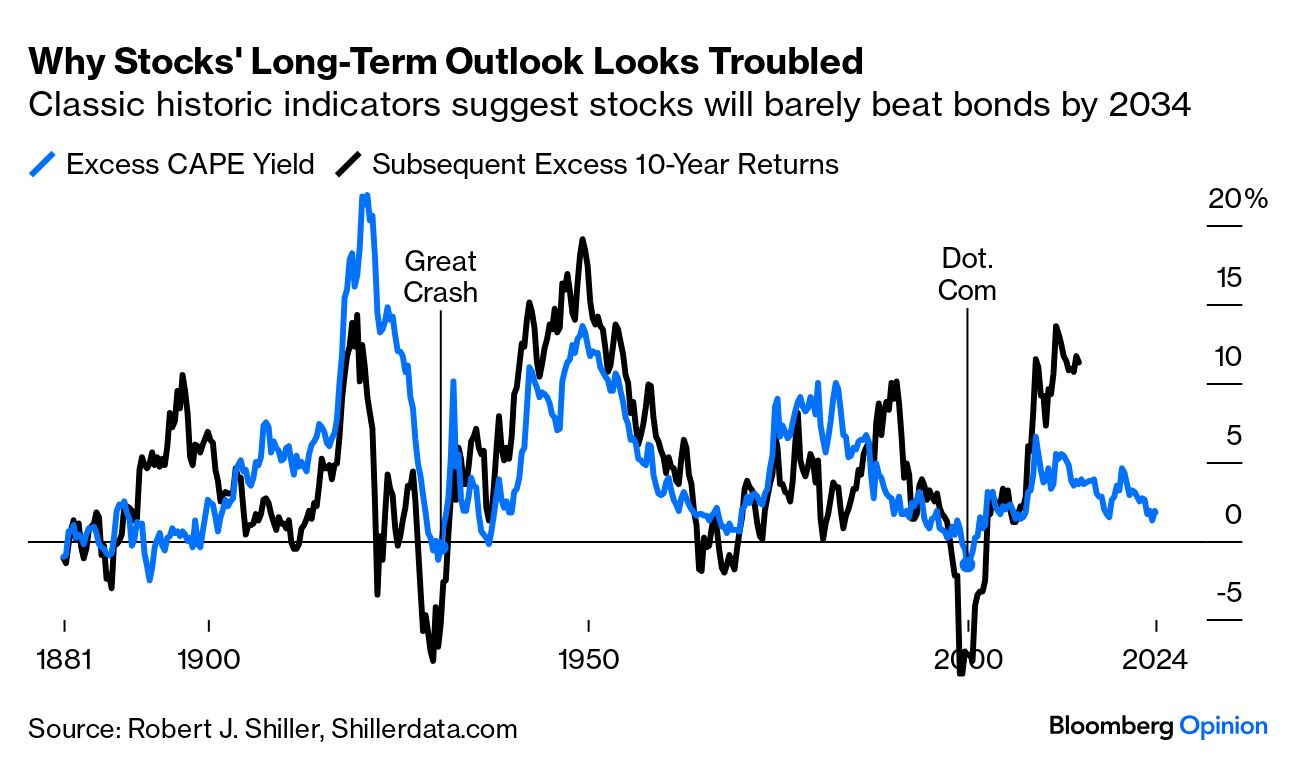 Again, something strange is afoot. Actual stock returns are exceeding forecast by the biggest margin since the 19th century. The most plausible explanation is the exceptional pandemic-era monetary stimulus, which wouldn't have appeared in any forecast. But the bottom line is that a reliable metric is telling us not to expect stocks to beat bonds, at a time when their recent returns look unnaturally high. Goldman's Kostin has his own subtler model, but it's also based on this central methodology of comparing Shiller's longer-term earnings yields to bonds. AI and stimulus checks have performed a lot of heavy lifting; it's sensible to expect them steadily to relinquish that weight. Note that these are specifically US arguments. Barclays Plc keeps updated measures of CAPE for a range of countries (which you can find here). At present, the US is far more expensive than other developed markets. 'Twasn't ever thus: Several countries were more expensive at the top of the dot-com bubble, even though its epicenter, like that of AI, was plainly the US: None of this tells us to sell US stocks now. But over 10 years, it suggests they'll lag other countries' stocks, and won't do very well compared to bonds. A central reason why this might be true is the power of the internet platforms known as the Magnificent Seven. There's no question that the US stock market (and by extension global equities) is unusually concentrated. What's questionable is whether this matters, or should prompt us to avoid stocks. Kostin finds that concentration is in its 99th percentile over history, and that it matters: When equity market concentration is high, performance of the aggregate index is strongly dictated by the prospects of a few stocks. Index performance in a high concentration environment will reflect a less diversified set of risks and will likely have greater realized volatility compared with returns in a less concentrated and more diversified market… Valuation should reflect a discount for higher volatility and less diversification during periods of extreme market concentration.
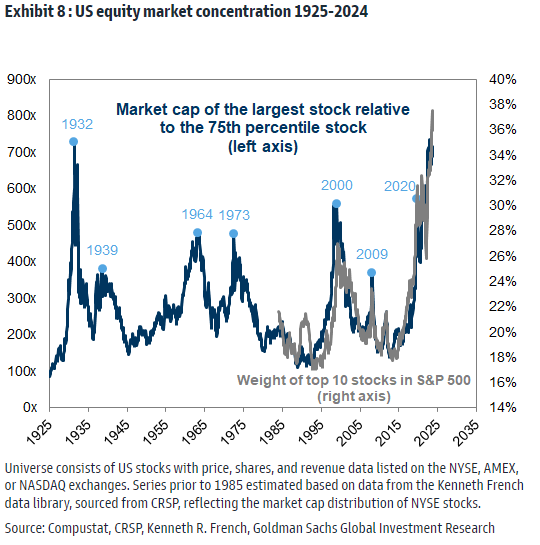
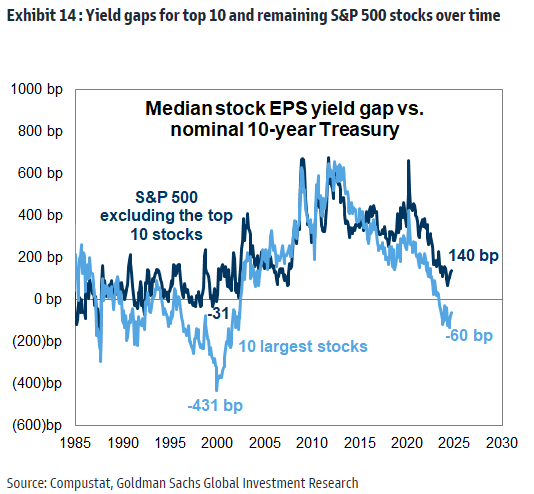
This is the share of the S&P 500 that the biggest 10 stocks have taken since 1980: In another Kostin chart, here is the ratio of the biggest stock to the 75th percentile company (bigger than 74% of the index) since 1925. Previous spikes ovelapped with notable moments, either to buy (as in 1932 and 2009) or sell (as in 1973 and 2000). Generally extreme concentration happens when the economy is on the floor with few left standing (not the case now), or when excitement prevails (as with the Nifty Fifty in 1973 and dot-coms in 2000): Kostin shows that concentration affects valuation. Exclude the biggest 10 stocks, and the S&P 500 is yielding more than the 10-year Treasury bond; the 10 largest themselves are yielding less, which should be a screaming sell signal: Does this mean that we shouldn't be too worried about US stocks, just the few giants? The dominance of the Magnificent Seven also explains why the US seems so much more expensive than everyone else. But it's a subtle case. Using multiples to book, we find that Bloomberg's index of the 500 biggest US stocks excluding the Mag 7, initiated in 2015, is at a record. It's cheaper than the overall S&P, but going back it's noticeably more expensive than the market has been for most of the last 30 years, outside the top of the dot-com bubble. It's not extreme but doesn't imply great 10-year returns either: 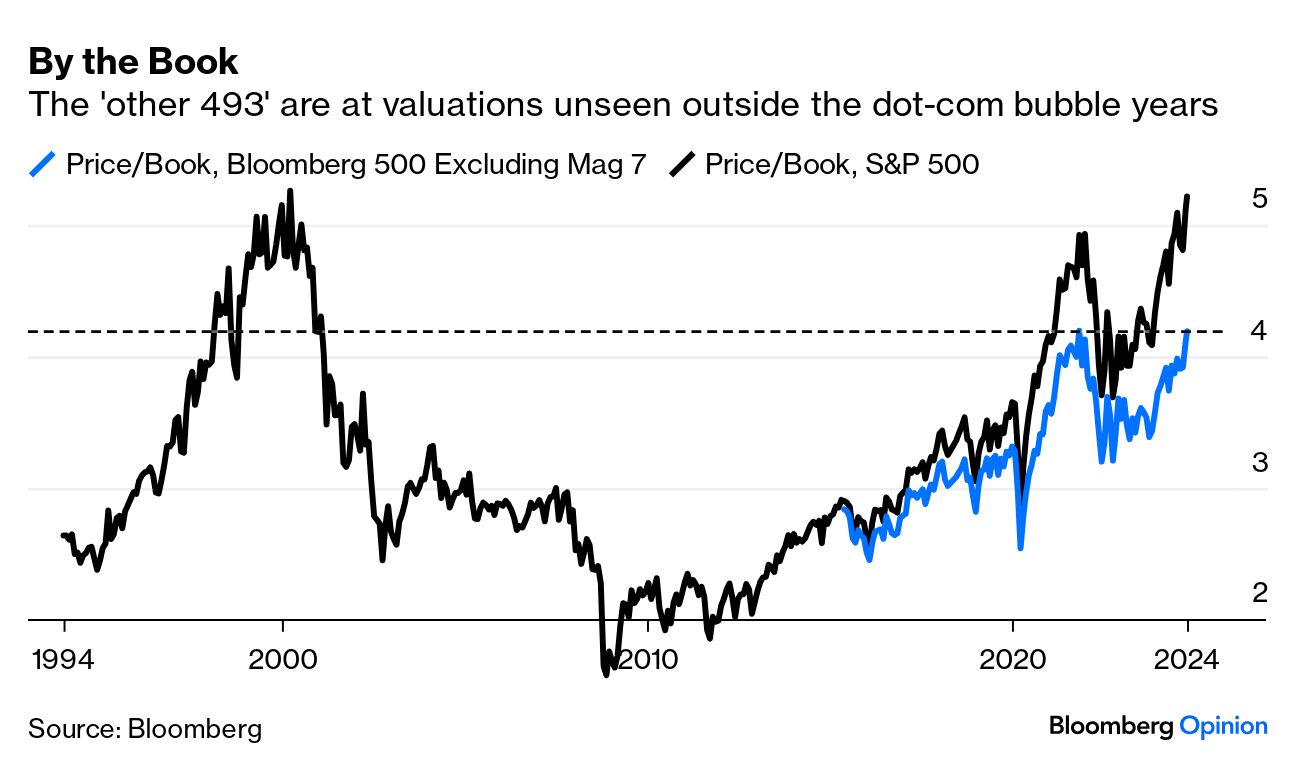 Particularly when investing in stocks is dominated by index funds, much of the money pouring into the Magnificents also sluices into the rest of the market. So it does make sense to factor in extreme concentration as reason to regard stocks' position as more vulnerable. Generally, a strategy of buying only the very largest stocks is a loser, as they have nowhere to go but down, and their competitive position will steadily be eroded. If you're not convinced concentration matters, Kostin says excluding it would raise the next decade's return from the seventh percentile since 1930 (worse than all bar six 10-year periods) to 22nd. Even if we ignore it, it's hard to make a positive case for equities over the next decade. But momentum looks set to keep stocks rising for now, so move carefully. For entertaining listening that explains how we reached a point where Elon Musk is offering $1 million prizes for registering to vote, I recommend The Evening Rocket, a podcast by Harvard historian Jill Lepore. Made three years ago, before Musk had bought Twitter, it suggests we should look at his upbringing and early exposure to science fiction to understand him. I wrote about it here, and it's great listening. Have a great week everyone.
Like Bloomberg's Points of Return? Subscribe for unlimited access to trusted, data-based journalism in 120 countries around the world and gain expert analysis from exclusive daily newsletters, The Bloomberg Open and The Bloomberg Close.
More From Bloomberg Opinion: Want more Bloomberg Opinion? OPIN <GO>. Or you can subscribe to our daily newsletter. | 


No comments:
Post a Comment