| Restrictive zoning codes limit the housing supply and contribute to segregation, but the nuances of how and where this happens can be hard to nail down. Now, new datasets and maps are shining a light on the opaque laws that dictate the way we live. The Zoning Restrictiveness Index, launched in March by the Eviction Lab at Princeton University, and the National Zoning Atlas, an initiative that went live last year from the Cornell University Legal Constructs Lab, are seeking to make zoning data more comprehensive, standardized and accessible to the public. Their creators hope that a greater understanding of what can be built, and where, will empower reformers concerned about how zoning policies drive inequality and create barriers to housing. The Zoning Restrictiveness Index quantifies how difficult it is to build under the zoning codes of different cities and towns, enabling comparisons within and across metropolitan areas to identify the most exclusionary enclaves. To create the index, the Eviction Lab team pulled zoning texts for roughly 2,600 jurisdictions across more than 300 metropolitan areas in the US, a maze of databases and legal citations. Then, the team trained a machine learning algorithm to identify and standardize the codes, teaching it to look for keywords like minimum lot sizes, permitted residential density, and parking requirements. These signals of potentially exclusionary policies were then fed into an overall score for restrictiveness: The higher the score, the harder it is in that area to build. 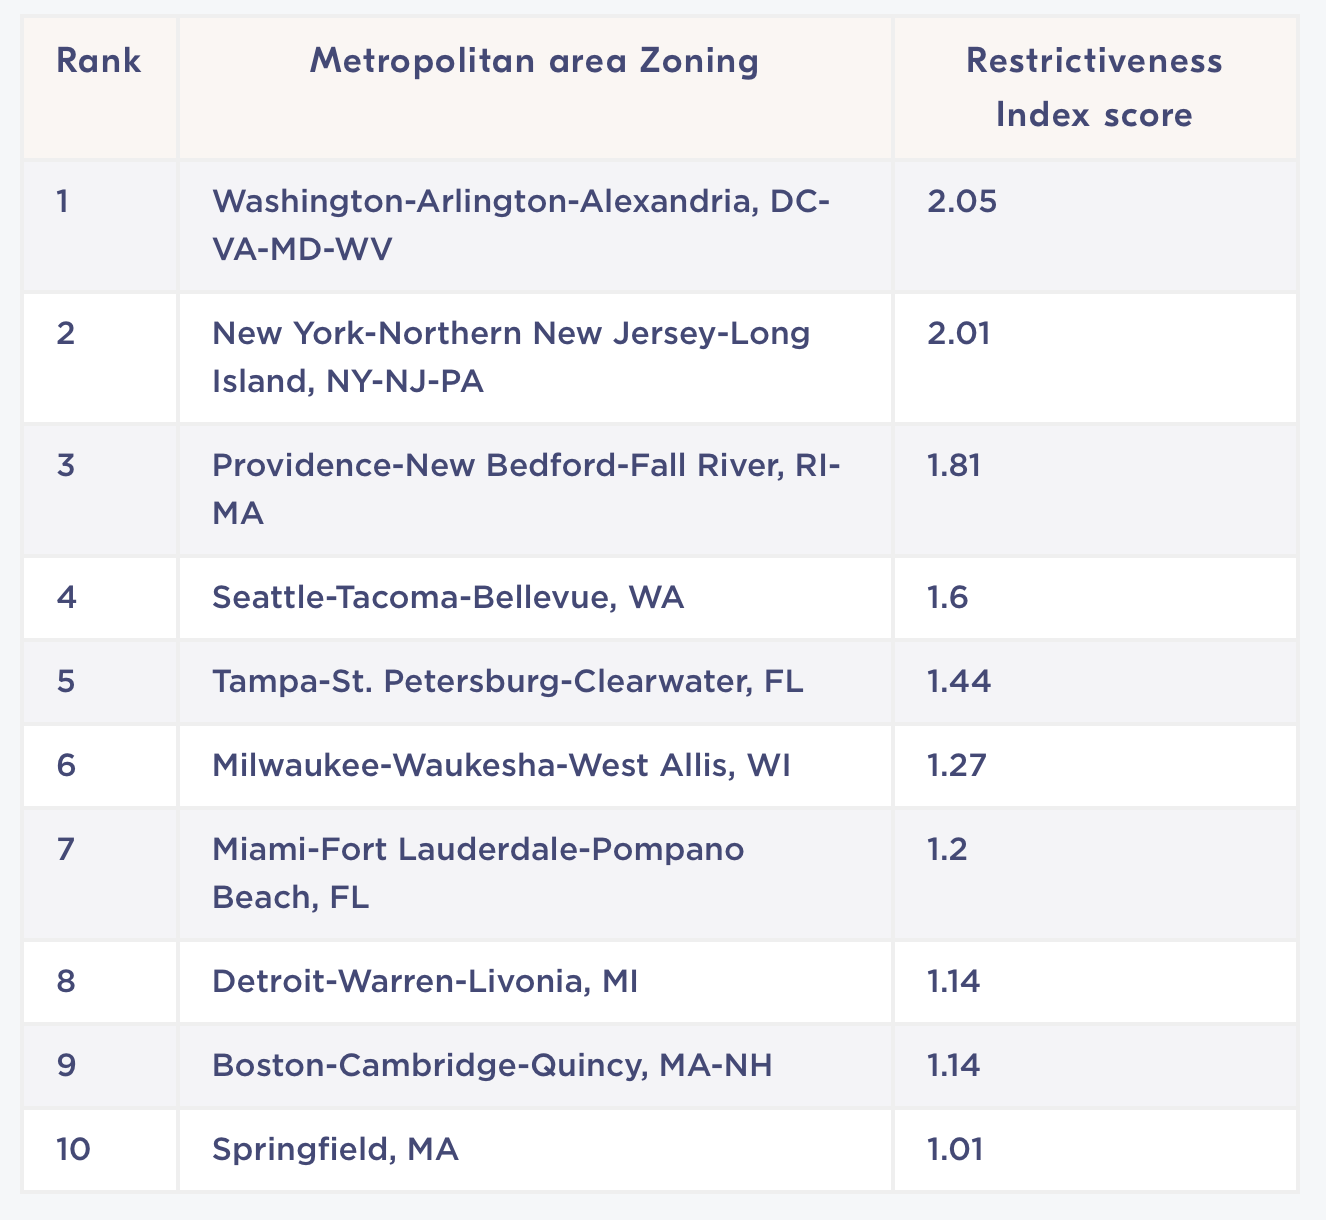 The top ten most restrictive metropolitan areas scored by the Zoning Restrictiveness Index. Credit: Eviction Lab While high-cost coastal cities often come to mind when it comes to housing-crunched communities, the Zoning Restrictiveness Index shows that the problem is widespread, said Matthew Mleczko, a Ph.D. student at Princeton who worked on the project and co-authored a March paper about it. According to the index, several Northeast metros have more restrictive zoning policies than the average US metropolitan area, but cities across the country have rules in place that limit the construction of new housing. "We also find that really, really segregated, not necessarily high-cost housing markets like Milwaukee and Detroit also show up as really restrictive," Mleczko said. 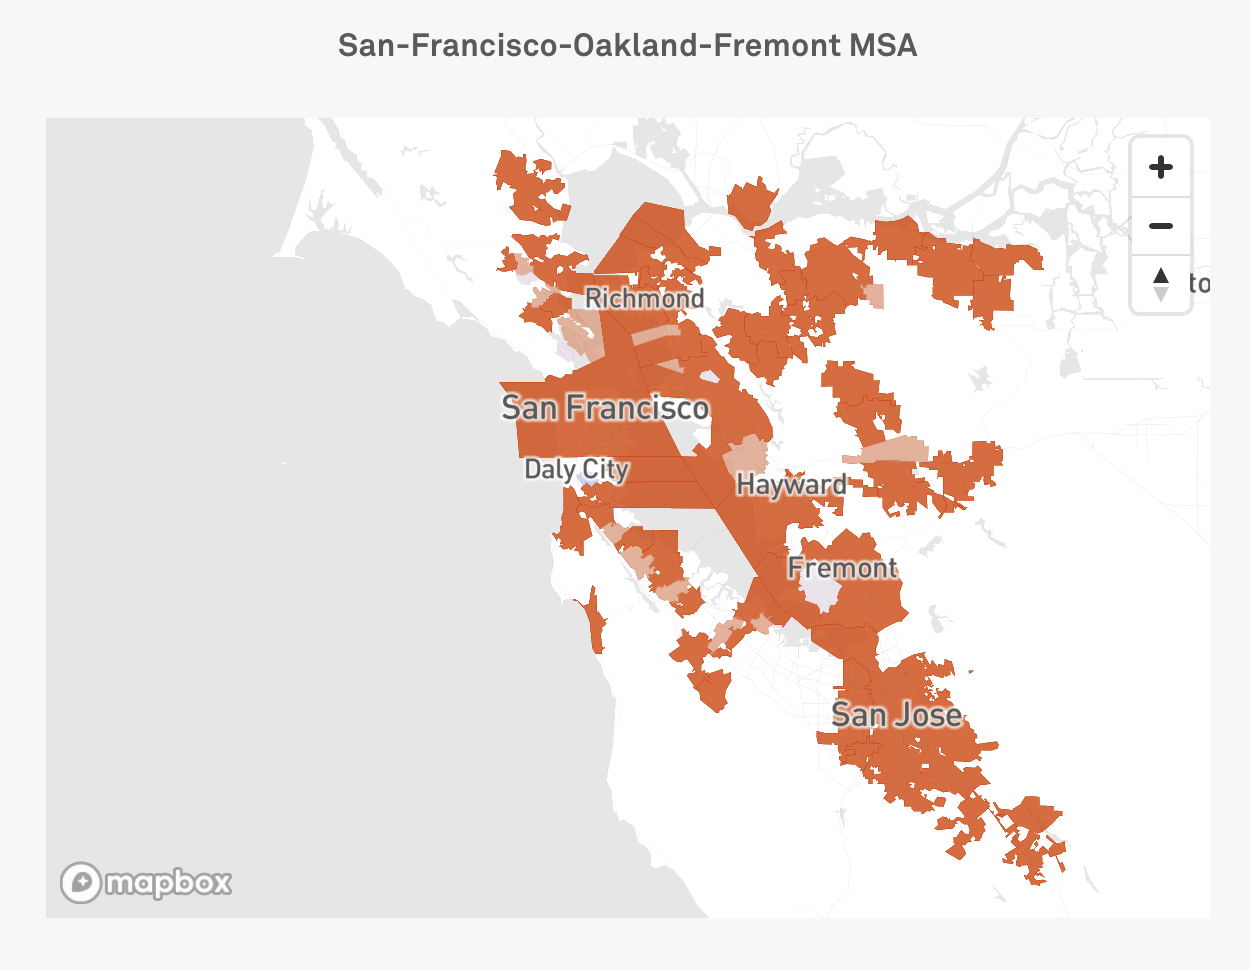 The darker the orange, the higher the zoning restrictiveness score in these communities across the San Francisco metropolitan area, where construction is highly constrained by zoning codes. Credit: Eviction Lab 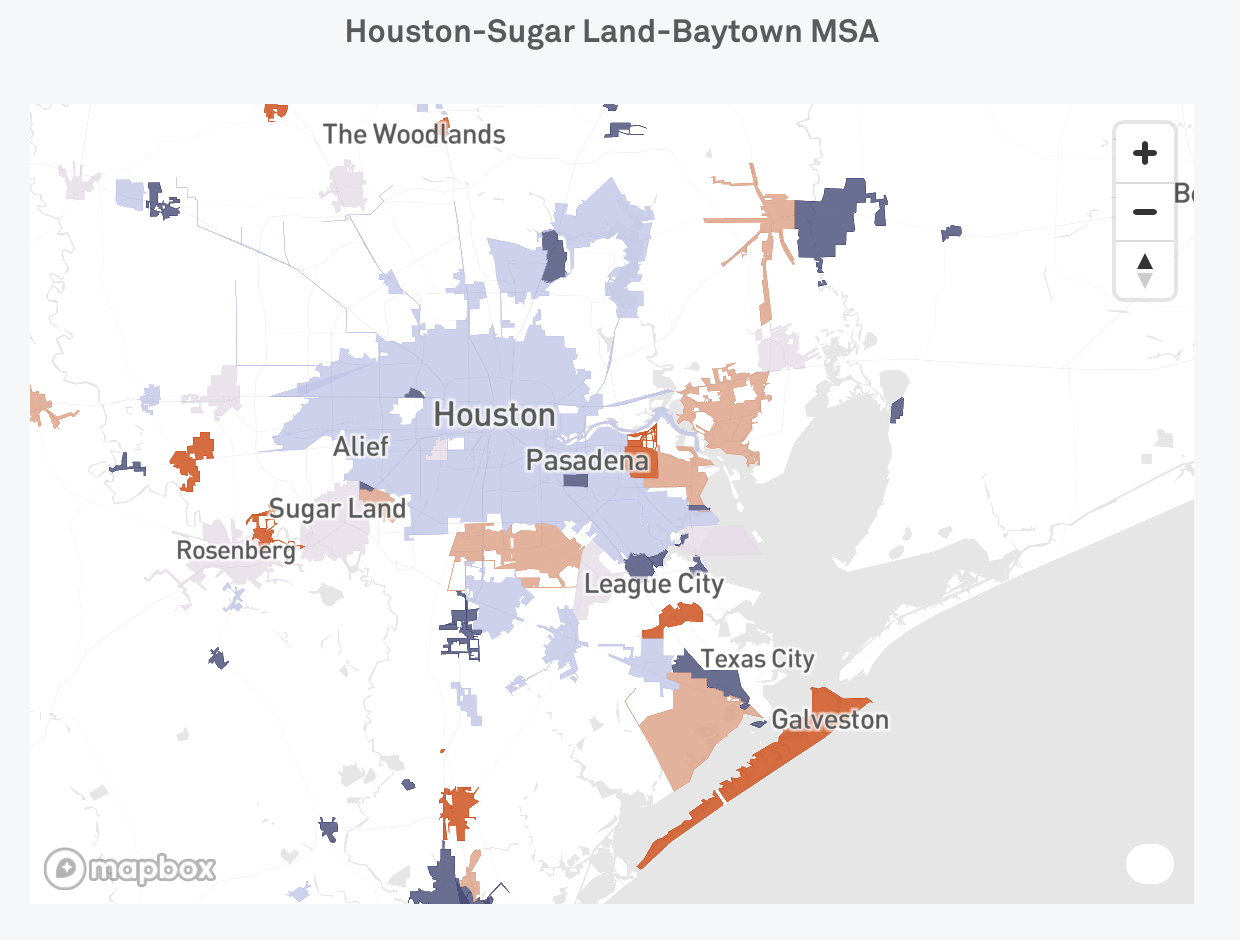 The darker the purple, the lower the zoning restrictiveness score in these communities across the Houston metropolitan area, where it's comparatively much easier to build housing than in the San Francisco Bay Area. Credit: Eviction Lab The National Zoning Atlas takes a more granular approach, crowdsourcing teams across the country to read through zoning codes and link them to geospatial data, one state at a time. It shows that not all zoning codes are equal, even among single-family residential zones that dominate most American cities and towns. Sara Bronin, the founder and director of the National Zoning Atlas, wrote about the project for CityLab in 2022. In a June study, researchers at the Urban Institute studied the National Zoning Atlas' statewide map of Connecticut and found evidence that exclusionary zoning rules are linked to segregation. In that state, 80 percent of residential land requires a one-acre minimum lot size. Suburbs and small towns that devote more of their land to single-family homes tend to be whiter, wealthier, more educated and more segregated, according to the study. "These laws are the means by which jurisdictions can indicate what class of residents they want to have as their citizens," said Lydia Lo, one of the study's authors. "By mandating minimum amounts of [land], you are mandating somewhat of a minimum cost that the family has to be able to bear and thus a minimum income that they have to be able to earn." 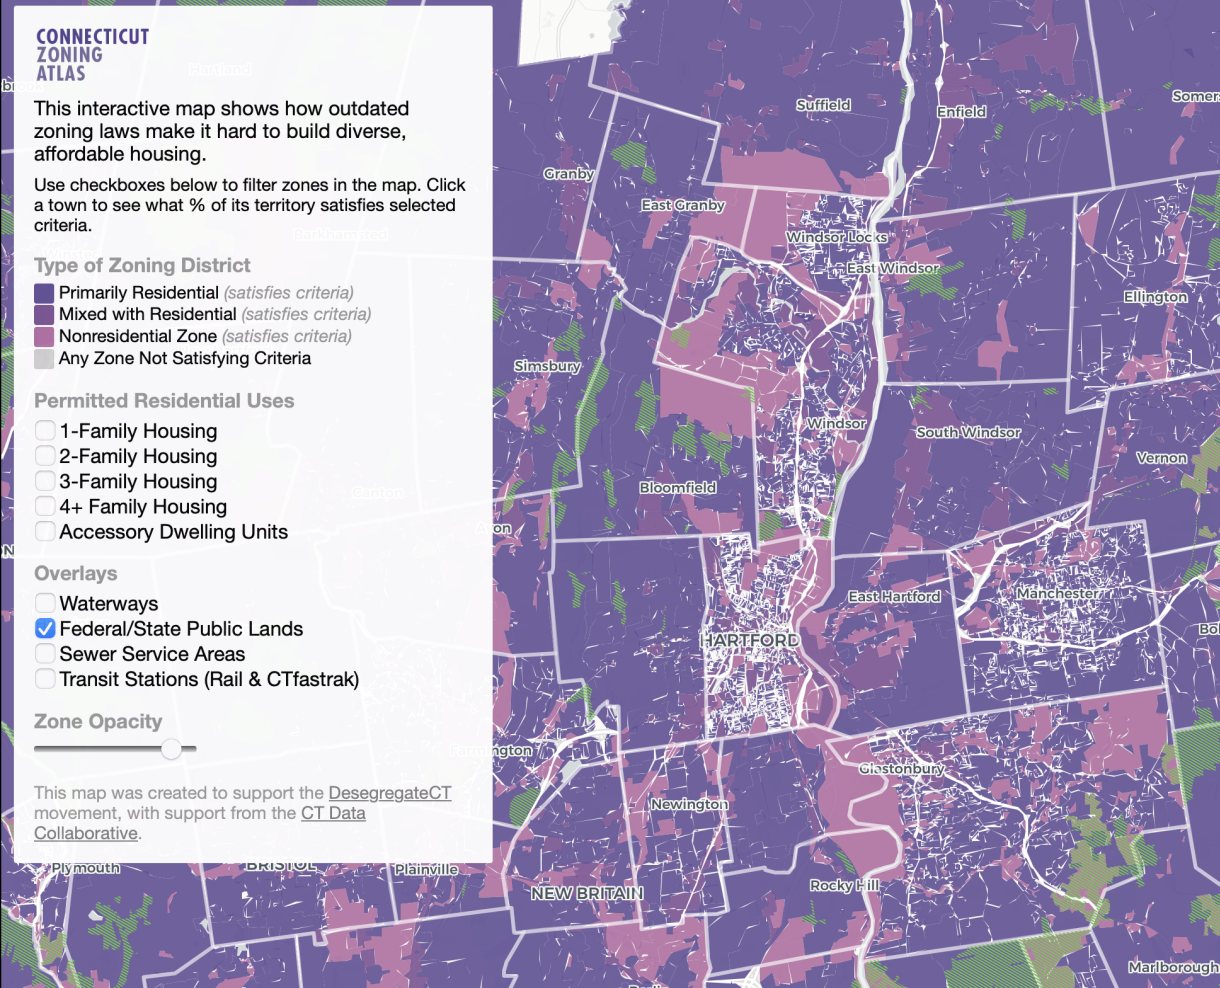 A detail from the Connecticut Zoning Atlas, part of the National Zoning Atlas, maps the residentially dominated kaleidoscope of zoning codes across that state. Credit: Connecticut Zoning Atlas Advocates are also making use of the Atlas. Zoning maps of Montana helped power recent YIMBY reforms that unlocked more multifamily housing, permitted accessory dwelling units, and eliminated parking minimums in that state, according to Bronin. It helped show how local codes tamped down supply and inclusion. "If a jurisdiction claims they allow multi-family housing, but in fact only allows multi-family housing on a block or on a few parcels," said Bronin, "the Zoning Atlas exposes that." The data reveals broader patterns of exclusion, too. CityLab analyzed data from all 2,600 U.S. municipalities in the Zoning Restrictiveness Index to understand how local codes vary by geography. Using the ZRI as well as the Urbanization Perceptions Small Area Index, a dataset maintained by the U.S. Department of Housing and Urban Development that tracks how Americans describe their neighborhoods, CityLab found that suburbs had the most restrictive zoning compared with urban and rural areas. Across the country, municipalities with more restrictive zoning were also more educated, whiter, and had higher median household incomes than those with less restrictive zoning. That finding points to zoning's potential effects on access not only to housing but to opportunities concentrated in certain neighborhoods, like schools and jobs. "When you start to look at patterns within a metro area, and the restrictiveness gap in different communities, you start to put together a broader picture," said Mleczko. "Exclusionary zoning is a potent mechanism for establishing and enshrining residential segregation, both by race and ethnicity, but also class." — Patrick Spauster | 


No comments:
Post a Comment