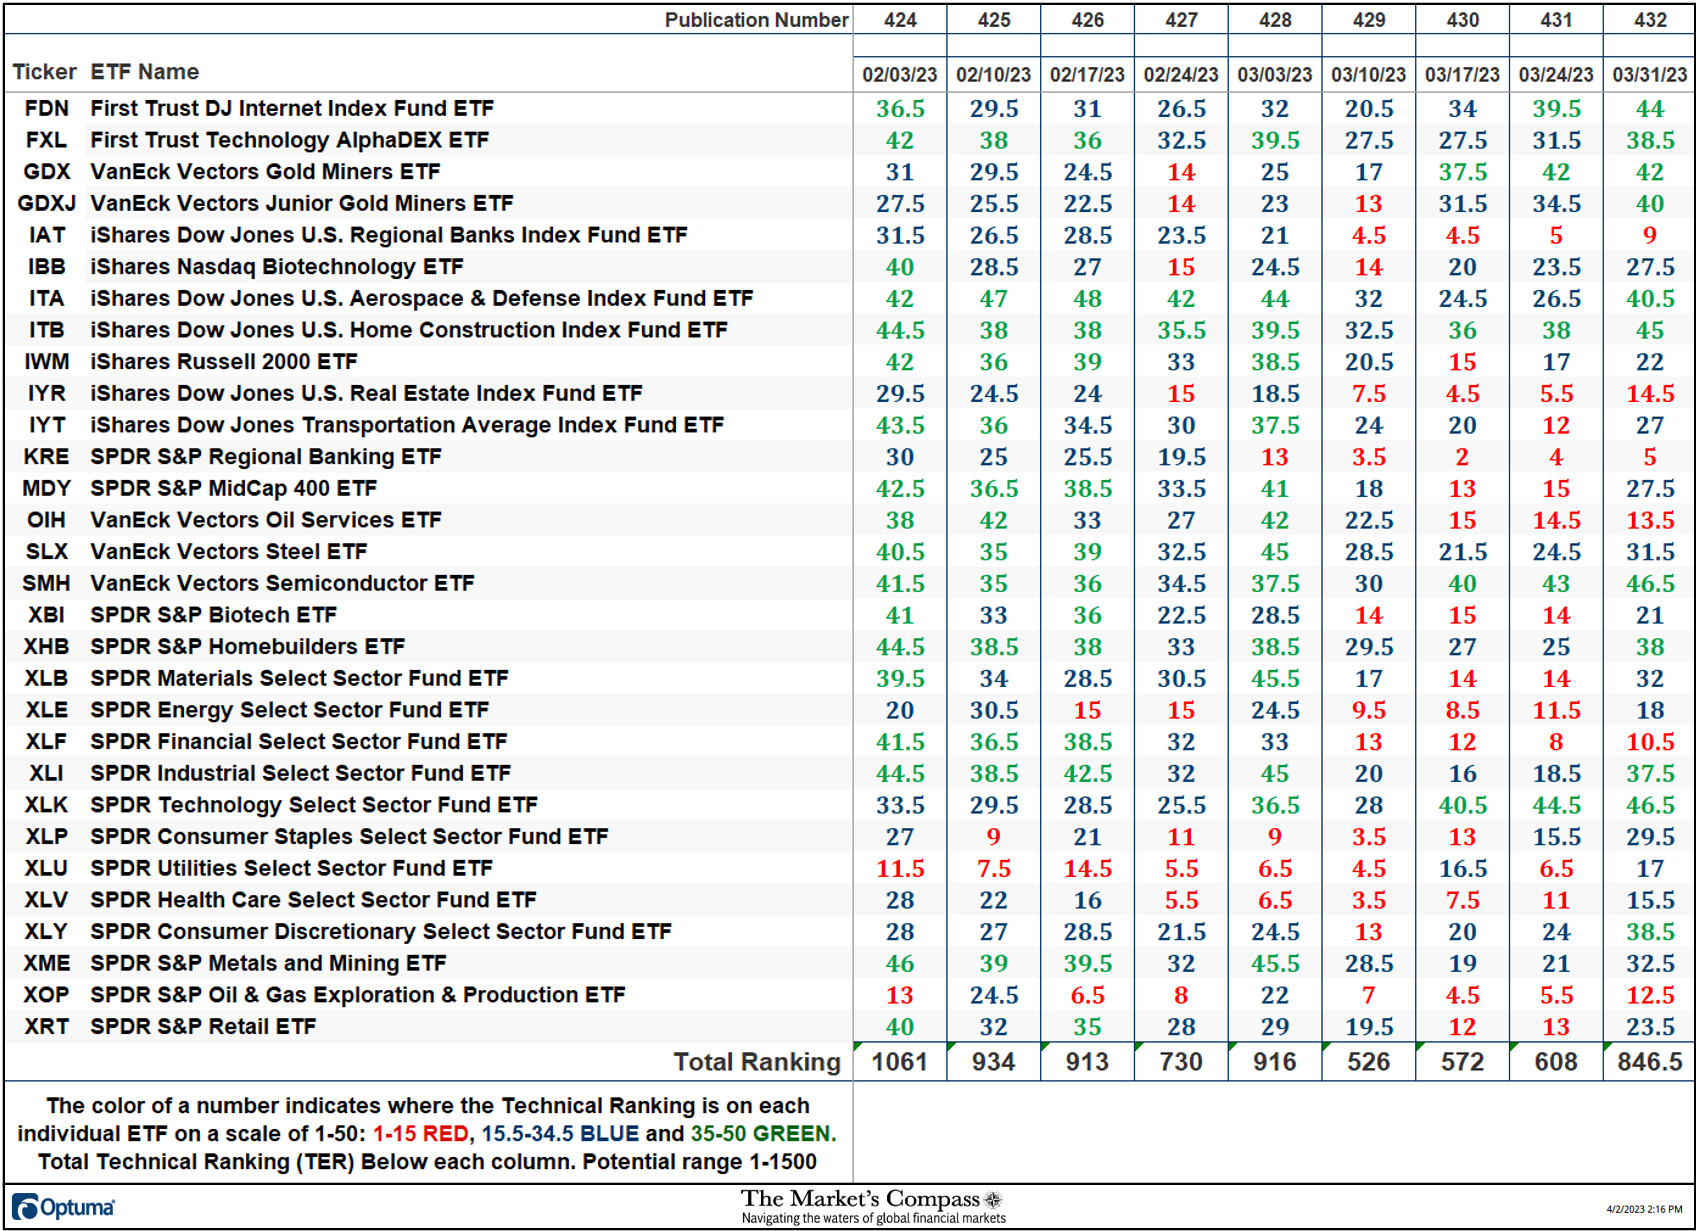
Welcome to The Market’s Compass US Index and Sector ETF Study, Week #432. It will highlight the technical changes of the 30 US Index and Sector ETFs that I track on a weekly basis and publish every third week. Paid subscribers will receive this week’s unabridged Market’s Compass US Index and Sector ETF Study sent to their registered e-mail. Free subscribers will receive an excerpt of the full version. Past publications can be accessed by paid subscribers via The Market’s Compass Substack Blog. Next week we will be publishing The Markets Compass Developed Markets Country ETF Study. Last Week’s and 8 Week Trailing Technical Rankings of the Individual US ETFs The Excel spreadsheet below indicates the weekly change in the objective Technical Ranking (“TR”) of each individual ETF. The technical ranking or scoring system is an entirely quantitative approach that utilizes multiple technical considerations that include but are not limited to trend, momentum, measurements of accumulation/distribution and relative strength. If an individual ETFs technical condition improves the Technical Ranking TR rises and conversely if the technical condition continues to deteriorate the TR falls. The TR of each individual ETF ranges from 0 to 50. The primary take away from this spread sheet should be the trend of the individual TRs, either the continued improvement or deterioration, as well as a change in direction. Secondarily, a very low ranking can signal an oversold condition and conversely a continued very high number can be viewed as an overbought condition, but with due warning, over sold conditions can continue at apace and overbought securities that have exhibited extraordinary momentum can easily become more overbought. A sustained trend change needs to unfold in the TR for it to be actionable.
For the week ending March 24th (the week before last) there were 5 ETFs in the “green zone” (TRs from 35-50), 11 were in the “blue zone” (TRs from 15.5 -34.5) and 14 were in the “red zone” (TRs from1-15). At the end of last week there were 11 ETFs in the “green zone”, 13 in the “blue zone”, and 6 in the “red zone” (a marked improvement in the individual technical rankings). Since we last published the US Index and Sector ETF Study four weeks ago on March 13th, for the week ending March 10th, 28 ETFs have registered an improvement in their TRs and only 2 have registered lower TRs. The VanEck Vectors Oil Services ETF (OIH) fell -9 to 13.5 from 22.5 and the SPDR Financial Select Sector Fund ETF (XLF) dropped -2.5 “handles” to 10.5 from 13. The Total ETF Ranking (“TER”) ended last week at 846.5 up from the 608 from the previous week. Last week’s 846.5 reading marked a +38% gain in the “TER” since we last published on March 13th. That TER reading four week's ago (526) was the lowest since October of last year and it proved to be a reliable oversold reading. Thoughts on the short-term technical condition of the SPX Index*
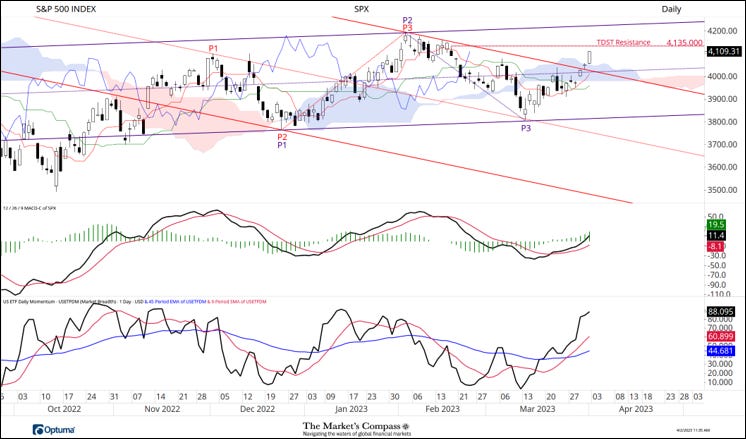
*Of interest to scalpers, traders, and technicians There a several positive technical features of note on the Daily Candle chart of the S&P 500 Index. Starting with the SPX overtaking and closing above resistance at the Median Line (purple dotted line) of the Schiff Modified Pitchfork (P1 through P3) on Tuesday. On Wednesday the rally followed through and the large cap index traded and closed above the Upper Parallel (solid red line) of the Standard Pitchfork (red P1 through P3) and on Friday prices traded back above the Cloud. The next technical hurdle is TDST Resistance at 4,135. MACD is curling higher above its signal line and is tracking into positive territory. One concern is that my US ETF Daily Momentum Oscillator is beginning to tread into overbought territory suggesting a measure of backing and filling is likely in order. Key support is at 3,980. Become a paid subscriber to receive the entire ETF Studies and Crypto Sweet Sixteen Studies sent to your email once a week. For readers who are unfamiliar with the technical terms or tools referred to in the comments on the short-term technical condition of the SPX can avail themselves of a brief tutorial titled, Tools of Technical Analysis or the Three-Part Pitchfork Papers that is posted on The Markets Compass website… https://themarketscompass.com Charts are courtesy of Optuma. To receive a 30-day trial of Optuma charting software go to… Read The Market's Compass Technical View in the app Listen to posts, join subscriber chats, and never miss an update from The Market's Compass.
|
Monday, April 3, 2023
The Market's Compass US Index and Sector ETF Study Excerpt
Subscribe to:
Post Comments (Atom)
Beat the Market: Get Ready for Earnings Season
Stay One Step Ahead – Prep for Earnings Season Now ͏ ͏ ͏ ͏ ͏ ͏ ͏ ͏ ͏ ͏ ͏ ͏ ͏ ͏ ͏ ͏ ͏ ͏ ͏ ͏ ͏ ͏ ͏ ͏ ͏ ͏ ͏ ͏ ͏ ͏ ...
-
La minute d'inspiration de BE A BOSS pour les BOSS Pensez à ajouter cette adress...
-
La minute d'inspiration de BE A BOSS pour les BOSS Pensez à ajouter cette adress...
-
L'actualité des BeaBoss chaque jour Pensez à ajouter cette adresse à votre carnet...


No comments:
Post a Comment