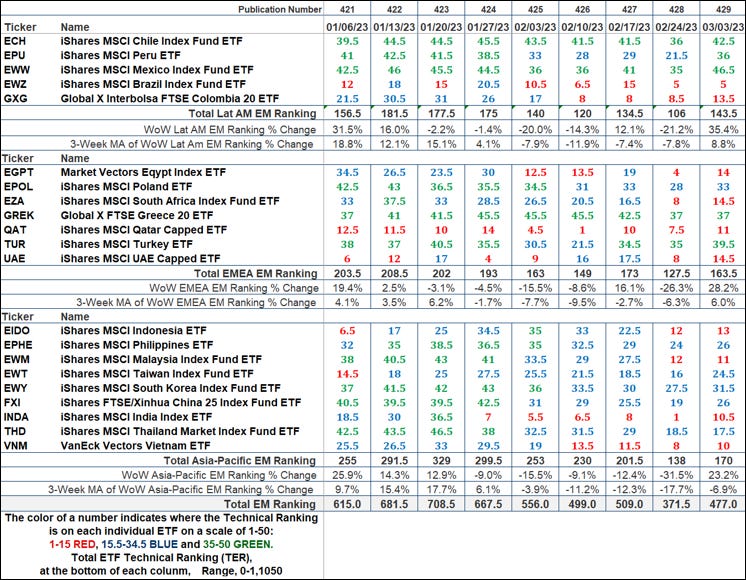
Welcome to The Market’s Compass Emerging Market’s Country ETF Study, Week #429. As always it highlights the technical changes of the 21 EM Country ETFs that I track on a weekly basis and publish every third week. Paid subscribers will receive this week’s unabridged Emerging Market’s Country ETF Study sent to their registered e-mail. Free subscribers will receive an excerpt of the full version. Past publications can be accessed by paid subscribers via The Market’s Compass Substack Blog. Next week we will be publishing the The Market’s Compass US Index and Sector ETF Study. Be on the look out for our new blog, The Market’s Compass Crypto Sweet Sixteen Study which is currently in development. Last Week’s and 8 Week Trailing Technical Rankings of the Individual EM ETFs The Excel spreadsheet below indicates the weekly change in the Technical Ranking (“TR”) of each individual ETF. The technical ranking or scoring system is an entirely quantitative approach that utilizes multiple technical considerations that include but are not limited to trend, momentum, measurements of accumulation/distribution and relative strength. If an individual ETFs technical condition improves the Technical Ranking TR rises and conversely if the technical condition continues to deteriorate the TR falls. The TR of each individual ETF ranges from 0 to 50. The primary take away from this spread sheet should be the trend of the individual TRs either the continued improvement or deterioration, as well as a change in direction. Secondarily, a very low ranking can signal an oversold condition and conversely a continued very high number can be viewed as an overbought condition, but with due warning, over sold conditions can continue at apace and overbought securities that have exhibited extraordinary momentum can easily become more overbought. A sustained trend change needs to unfold in the TR for it to be actionable. The TR of each individual ETF in each of the three geographic regions can also reveal comparative relative strength or weakness of the technical condition of the select ETFs in the same region.
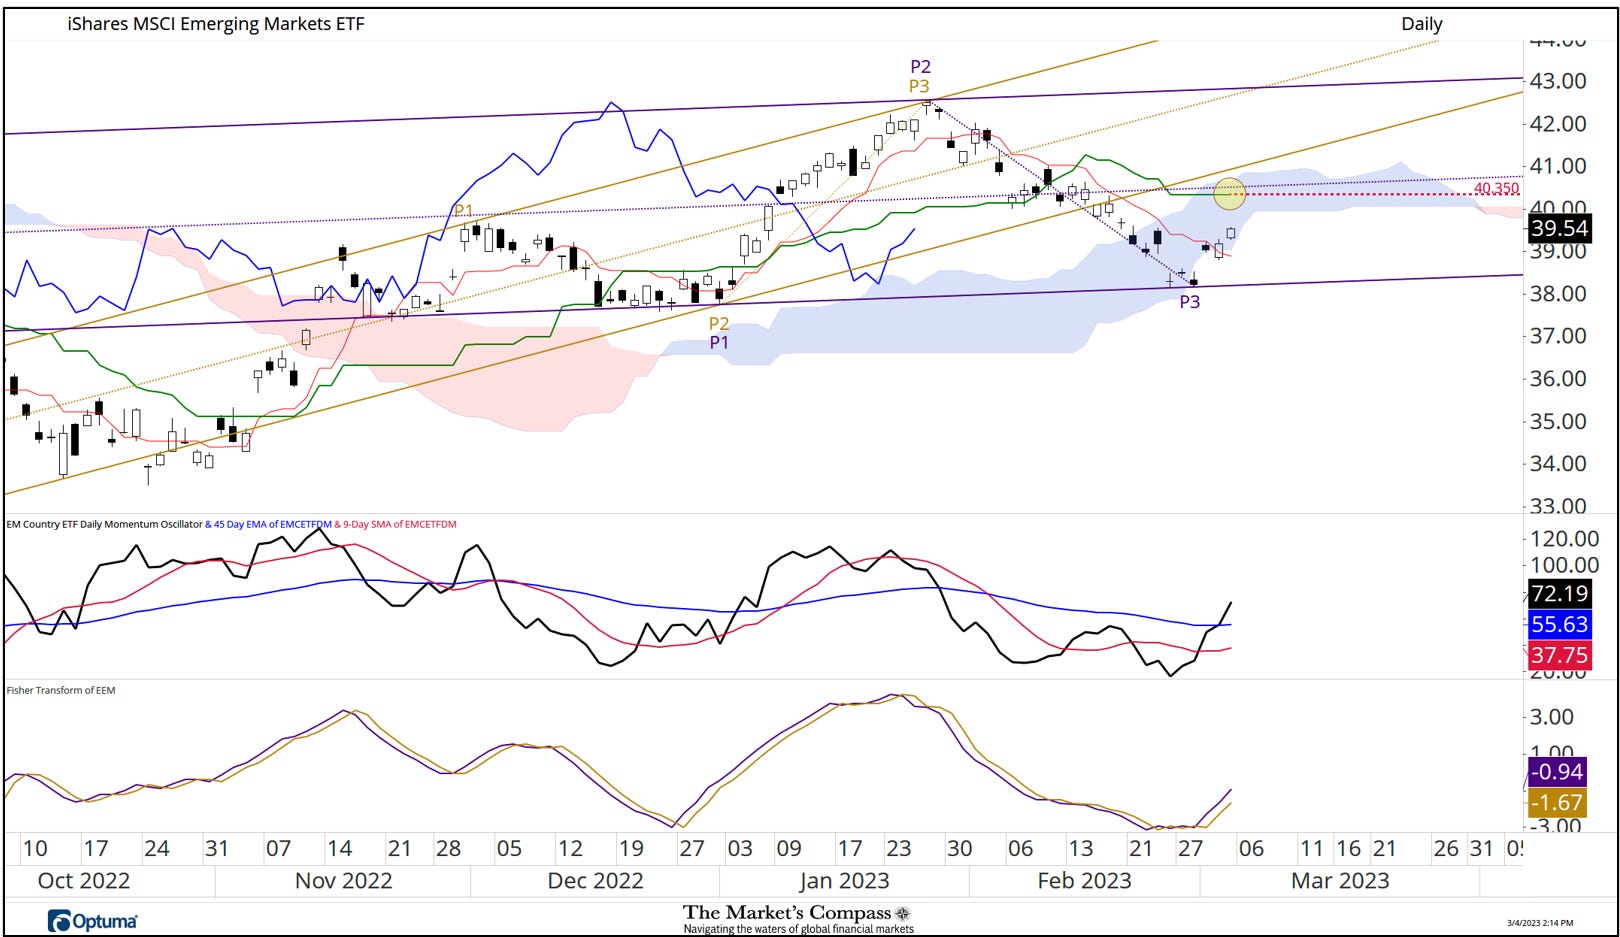
The largest gain in the three EM Region ETF Total Rankings since the week ending February 24th was in the the Lat-AM Region Total Technical Ranking which rose +35% to 143.5 from 106 which was a noticeable geographic outlier WoW. That was followed by the EMEA Region Total Technical Ranking Asia-Pacific Region Total Technical Ranking which rose +22% to 163.5 from 127.5, and a +19% gain in the Asia-Pacific Region Total Technical Ranking to 170 from 138. The Total EM ETF Technical Ranking rose +19% to 477 from 371.5. The week before last’s reading of 371.5 was the lowest Total EM Technical since the October 14th reading of 241 (see the weekly chart with EM Total Technical Ranking (TER) overlayed). That said, it ended that week +35% above that oversold October low and last week’s recovery to 477 only brought the TER back to near neutral territory. Thoughts on the Short-Term Technical Condition of the EEM*
*Of interest to traders, scalpers and technicians A week ago last Wednesday the EEM fell below the Lower Parallel (solid gold line) of the Schiff Modified Pitchfork (gold P1 through P3). Prices were unable to advance back into the Pitchfork and continued to trade lower below Cloud support until Wednesday of last week (also the first day of the new month) when the EEM “caught a bid” and rallied +0.82 points or +2.14% from a slightly higher low at P3. That was the genesis of the newly drawn Schiff Modified Pitchfork (purple P1 through P3). Why use that Pitchfork version you may ask? Notice that prior to Purple P1 that prices respected no only support at the Lower Parallel (solid purple line) they also respected resistance at the Median Line (purple dotted line). It was hardly a surprise that a rally unfolded from purple P3. My EM Country ETF Daily Momentum Oscillator had become deeply oversold and produced a minor non-confirmation at last Tuesday’s low. Prices ended the trading week on Friday back in the Cloud but there are a number of formidable technical hurdles that lay ahead. These include the Kijun Plot at 40.35 which by definition in this case is also a 50% Fibonacci retracement of the selloff from the recovery price highs at purple P2 / gold P3, the Median Line of the newly drawn Schiff Modified Pitchfork, potential resistance at the top of the Cloud and the previously broken Lower Parallel of the longer term Pitchfork (highlighted with the yellow circle). How prices respond to that cluster of resistance will speak volumes to either the new underlying strength or underlying weakness in the EEM. To read the entire Market’s Compass Emerging Markets Country ETF Study become a paid subscriber at… Charts are courtesy of Optuma whose charting software enables anyone to visualize any data. To receive a 30-day trial of Optuma charting software go to… tbrackett@themarketscompass.com Read The Market's Compass Technical View in the app Listen to posts, join subscriber chats, and never miss an update from The Market's Compass.
|
Monday, March 6, 2023
The Market's Compass Emerging Markets Country ETF Study Excerpt
Subscribe to:
Post Comments (Atom)
Macron’s Indian mission
Macron travels to India seeking new partnerships Read in browser Welcome to Balance of Power, bringing you the latest in global politics....
-
PLUS: Dogecoin scores first official ETP ...
-
Hollywood is often political View in browser The Academy Awards ceremony is on Sunday night, and i...


No comments:
Post a Comment