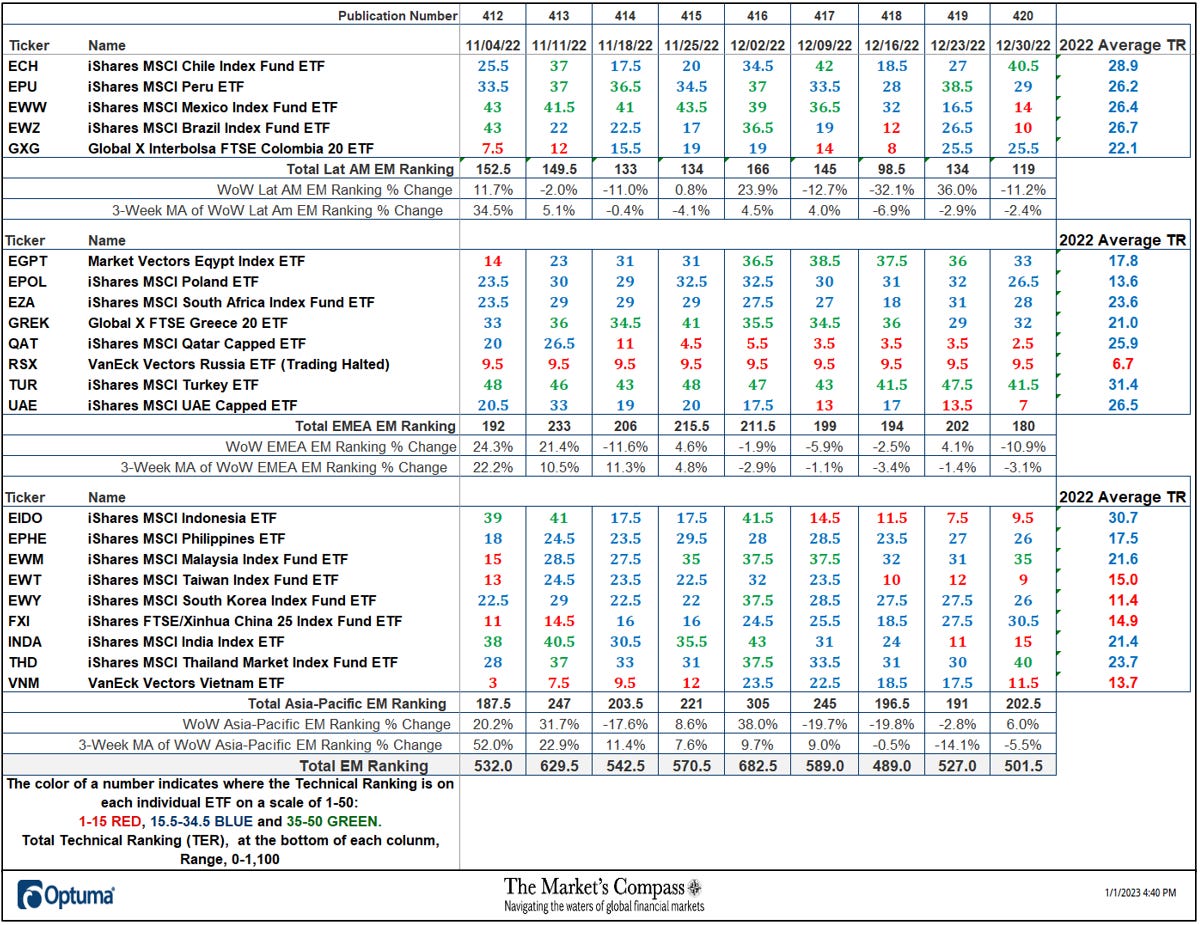
Welcome to the first ETF Study Excerpt of 2023, The Market’s Compass Emerging Market’s Country ETF Study, Week #420. It will highlight the technical changes of the 22 EM Country ETFs that I track on a weekly basis and publish every third week. Paid subscribers will receive this week’s unabridged Emerging Market’s Country ETF Study sent to their registered e-mail. Consider becoming a paid subscriber at $10 a month or $100 per year. Free subscribers will continue to receive an excerpt of the full version. Past publications can be accessed by paid subscribers via The Market’s Compass Substack Blog. Next week we will be publishing the The Market’s Compass US Index and Sector ETF Study. Last Week’s and 8 Week Trailing Technical Rankings of the Individual EM ETFs The Excel spreadsheet below indicates the weekly change in the Technical Ranking (“TR”) of each individual ETF. The technical ranking or scoring system is an entirely quantitative approach that utilizes multiple technical considerations that include but are not limited to trend, momentum, measurements of accumulation/distribution and relative strength. If an individual ETFs technical condition improves the Technical Ranking TR rises and conversely if the technical condition continues to deteriorate the TR falls. The TR of each individual ETF ranges from 0 to 50. The primary take away from this spread sheet should be the trend of the individual TRs either the continued improvement or deterioration, as well as a change in direction. Secondarily, a very low ranking can signal an oversold condition and conversely a continued very high number can be viewed as an overbought condition, but with due warning, over sold conditions can continue at apace and overbought securities that have exhibited extraordinary momentum can easily become more overbought. A sustained trend change needs to unfold in the TR for it to be actionable. The TR of each individual ETF in each of the three geographic regions can also reveal comparative relative strength or weakness of the technical condition of the select ETFs in the same region.
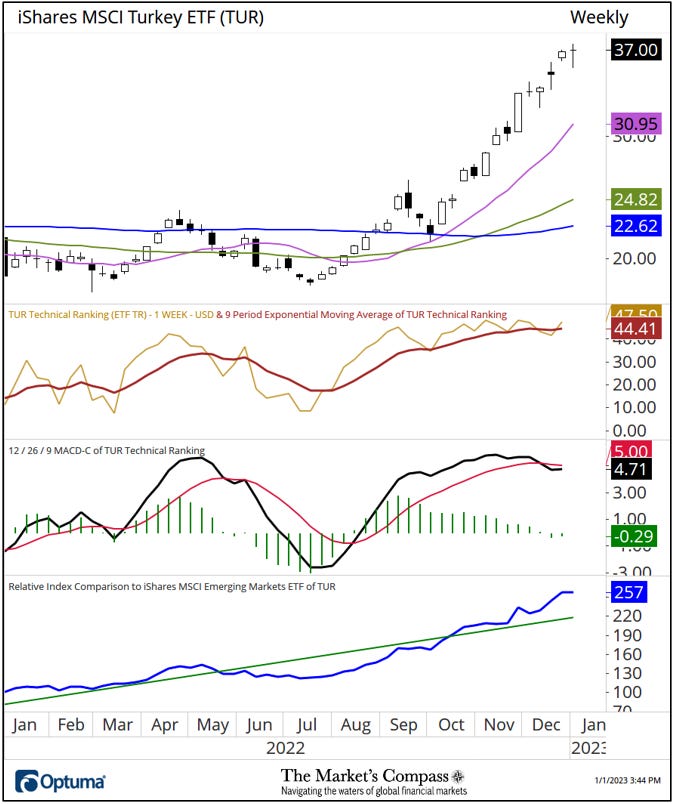
The largest drop in the three EM Region Total Rankings since the week ending December 9th was in the Lat-AM region which fell -17.93% to 119 from 145. That is followed by a slightly lesser loss of -17.35% in the Asia-Pacific Region Total Technical Ranking which fell to 202.5 from 245. The EMEA Region Total Technical Ranking lost ground over the same period but dropped less, -9.55% to 180 from 199. The Total EM ETF Technical Ranking fell -14.86 to 501.5 from 589 over the same period. Regular readers will notice that we have added a new column to the spread sheet posted above. That column shows the average TR reading of each of the 22 EM ETFs since the start of last year. The best TR average reading over the 12 month period was registered by the iShares MSCI Turkey ETF (TUR) at 30.7. We have highlighted the positive technical condition of the TUR several times over last year. As can be seen in the chart below and in panels that follow, the TUR has far outpaced the other 21 ETFs we track in these pages in 2022 and has been a relative outperformer vs. the EEM (note the linear regression line in green in the lower chart panel). We do note, there are early signs that there has been a slowing of upside momentum as witnessed by MACD.
To receive a 30-day trial of Optuma charting software go to… Data is courtesy of Bloomberg. I invite readers to contact me with any questions, comments, or suggestions at… tbrackett@themarketscompass.com Read The Market's Compass Technical View in the app Listen to posts, join subscriber chats, and never miss an update from The Market's Compass.
|
Tuesday, January 3, 2023
The Market's Compass Emerging Markets Country ETF Study Excerpt
Subscribe to:
Post Comments (Atom)
1日を始める前に読んでおきたいニュース5本
*ご意見をお聞かせください。本アンケートの所要時間は約5分です。皆様からのフィードバックは、今後のユーザー体験の向上に役立ててまいります。 マーケットで話題になったニュースをお届けします。一日を始めるにあたって押さえておきたい5本はこちら。人工知能(AI)スタート...
-
PLUS: Dogecoin scores first official ETP ...
-
Hollywood is often political View in browser The Academy Awards ceremony is on Sunday night, and i...


No comments:
Post a Comment