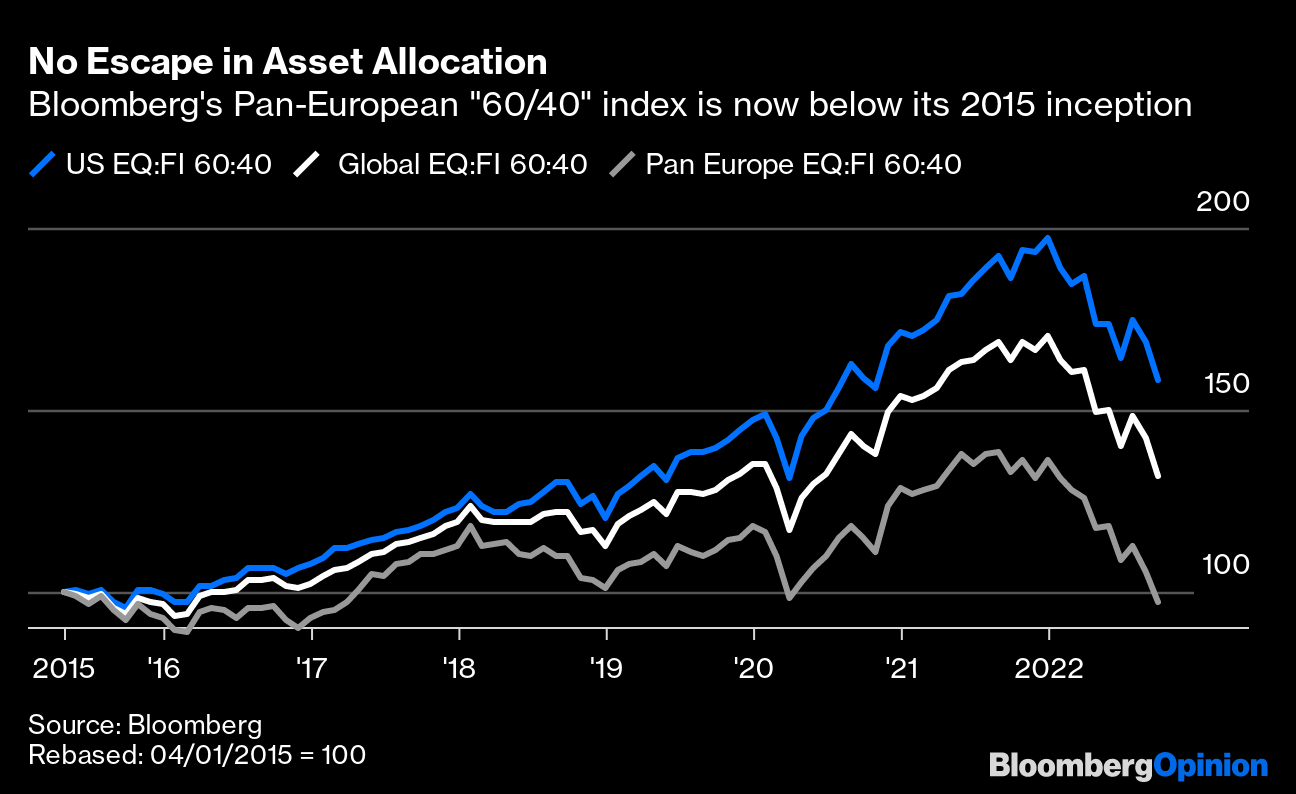
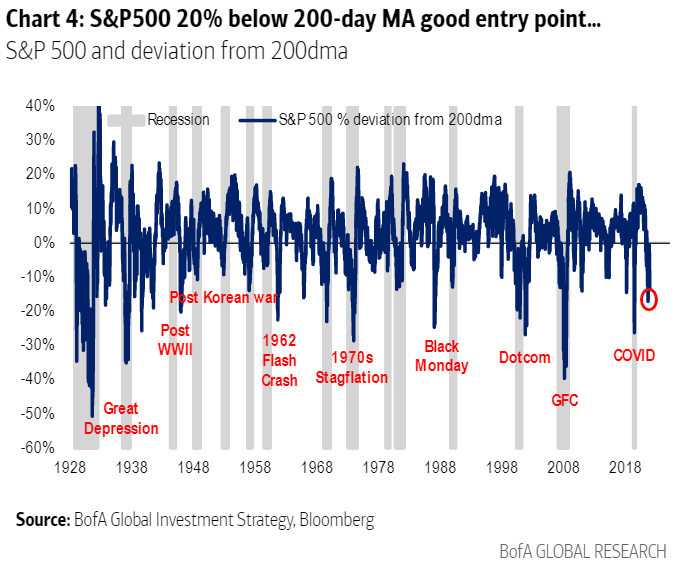
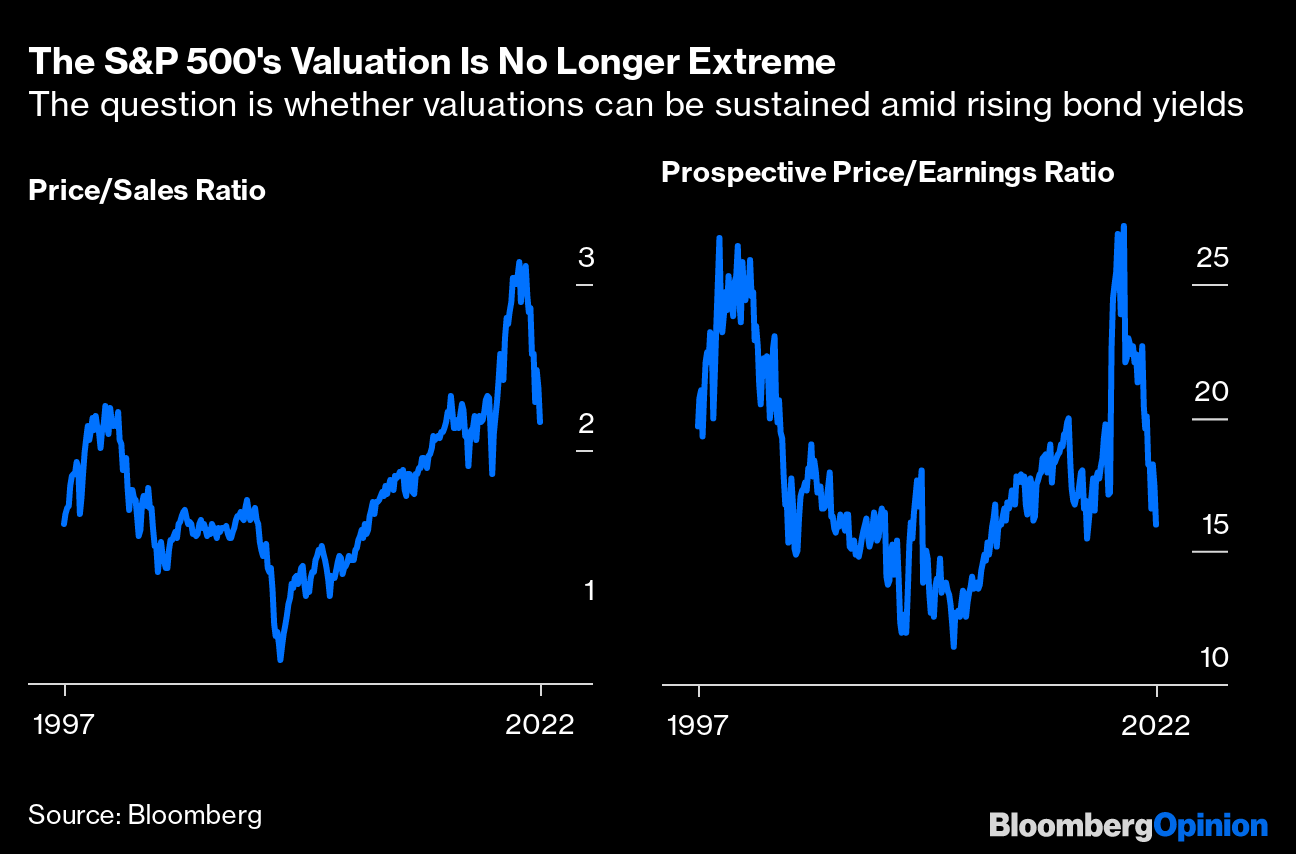
| October does not start auspiciously. The sting in September's tail involved surprisingly bad US inflation numbers that dampened hopes that the Federal Reserve would soon have to peg back its campaign of interest rate hikes. The Personal Consumption Expenditures deflator, compiled as part of the calculations of gross domestic product, is the Fed's favored measure of inflation. For a stripped version that statistical purists regard as probably the best measure of underlying core inflation, the Dallas Fed publishes a "trimmed mean" that excludes the biggest outliers in either direction and takes the average of the rest. Thus extreme moves such as last year's inflation in used car prices are excluded. And on this basis, US inflation is at its highest in almost four decades:  Those are the year-on-year figures. Many are now more concerned by month-on-month data, giving up-to-date estimates of inflationary momentum. This gives no cause for encouragement. In August, prices measured this way increased at an annualized rate of 6%, higher than anything that had been seen in four decades before the current inflation spike began. It was also a rise on July. There are multiplying signs that the Fed is beginning to bring inflation down, but they do not yet show up in the single most important data watched by the central bank: 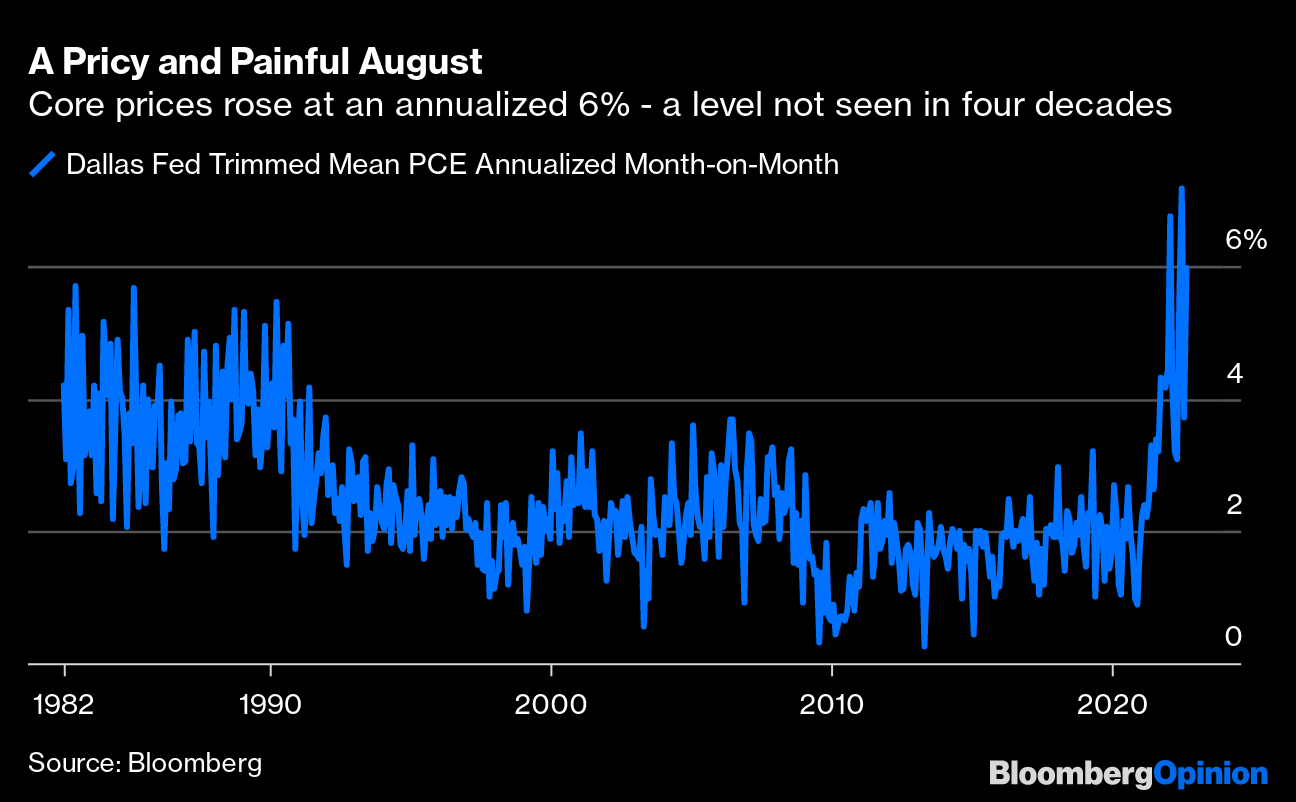 As for asset prices, again it's not great. The benchmark S&P 500 sold off to end the month, and the quarter, at a fresh low for the year. Both the Bloomberg Aggregate bond index and the S&P were down almost exactly 5% for the quarter, and it's the way the selloff is hurting both bonds and equities that makes this hard to deal with. In particular, note that in dollar terms a 60/40 strategy in Europe is actually under water since the Bloomberg index started in 2015: There's much discussion of a possible bear market rally, and that seems reasonable. Compared to its own 200-day moving average, the S&P looks seriously oversold. This chart from Michael Hartnett of Bank of America Corp. shows that the market has come down so swiftly that at least a bounce seems very plausible: As for valuation, never useful for timing but very useful for deciding whether to buy on a longer-term time horizon, the signals are now ambiguous. Looking at the S&P's multiple of both sales and prospective earnings, it's fair to say that the extreme bubbly response to the Covid shutdowns has now been flushed out. As a multiple of earnings (although not sales), valuations are roughly where they were for much of the post-crisis period. Neither suggests that this is an absolutely compelling time to buy: Instead, two critical matters lie ahead. First, bond yields. If they keep rising, it's reasonable to expect stock multiples to keep falling. And second, earnings. The continuing very high multiple of sales for the S&P suggests strong confidence that profit margins can be sustained. Can they? If the fight against inflation is to continue, it's hard to see how they can. It's hard to ignore the global synchronization happening when it comes to central bank tightening monetary policies. While such lockstep moves do not come as a surprise given multi-decade high inflation in the world's biggest economies, the ramifications in the financial markets have been on full display. Just how linked are the central banks? Of the nearly 40 that Ned Davis Research tracks, only 12% are in easing cycles. The only time the percentage was lower than this was in 2006, as central banks were unsuccessfully trying to rein in commodity price inflation. Everyone knows what happened to stock markets the following year: 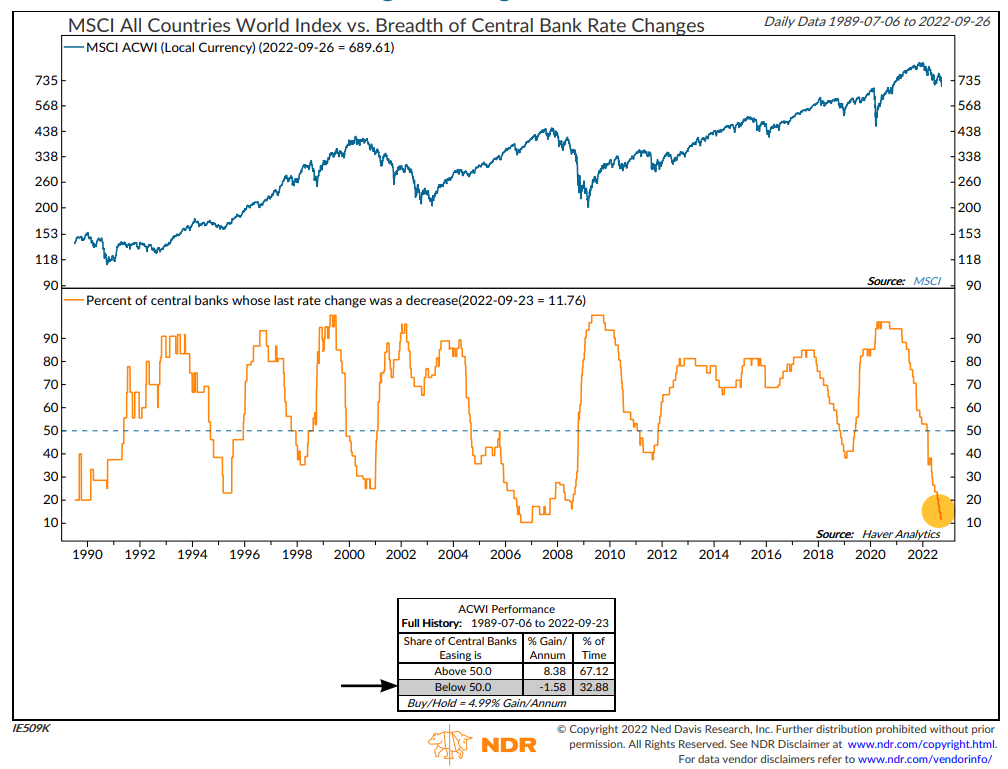 Ned Davis Research According to NDR, the pace of tightening — doubling to 170 basis points since the beginning of 2022 — has seen the largest gain since it started analyzing data in 2000. Such magnitude and speed have historically presented headwinds to global equities, said NDR's Alejandra Grindal and Patrick Ayers: Earlier this year, we were able to make the case that these tighter policies were coming from extremely accommodative levels, thereby making them less disruptive to the global economy. However, at the pace central banks are going, our calculation of the global central bank rate is likely to reach historically restrictive levels by early next year. This falls in line with our view that the risk of severe global recession is increasing in the near-term.
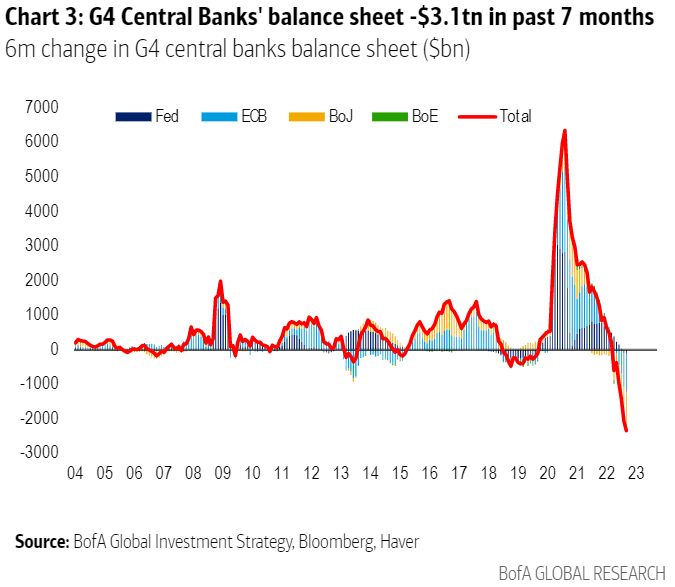
Another factor to consider is quantitative tightening, famously known as QT. Acknowledging small sample size, NDR found that when the aggregate shrinks, weak global equity performance usually is not far off. US equities last week saw their worst monthly rout since March 2020, with the S&P 500 suffering its third straight quarter of losses for the first time since 2009. 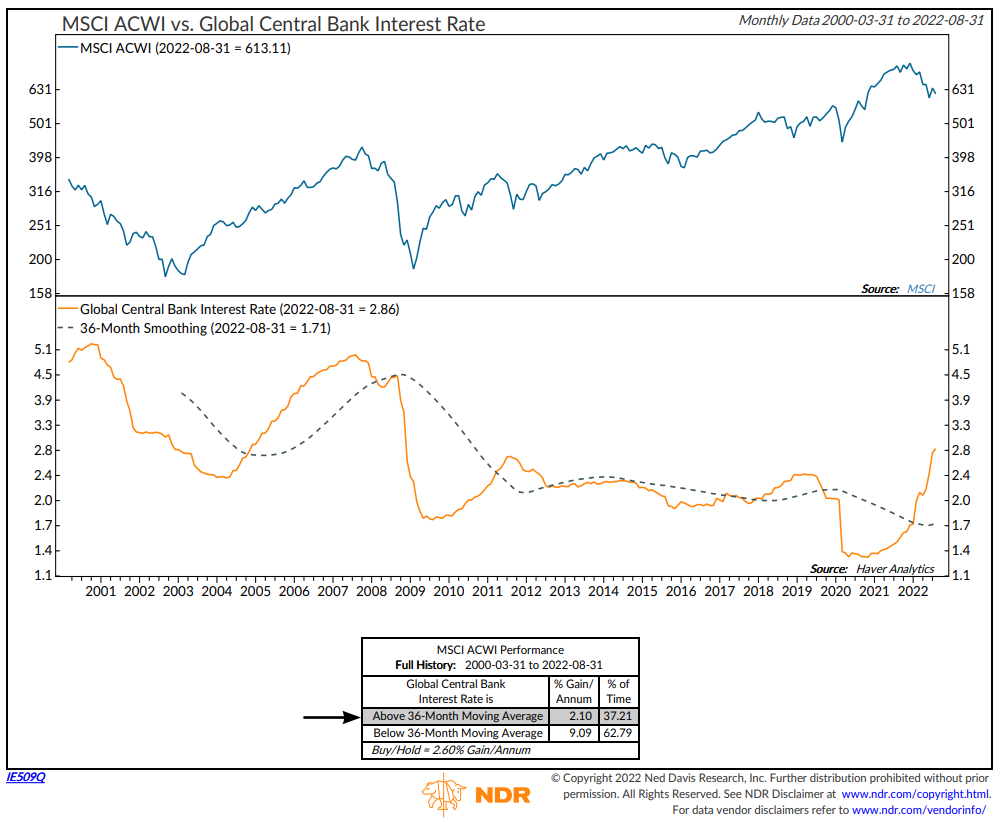 Ned Davis Research The following chart shows an exercise by Hartnett at BofA to sum changes in central banks' balance sheets across the world. On this basis, the tightening pressure is on a scale never before seen: Most corners of the market, particularly risk assets, have been on a downtrend ever since the Fed delivered its third jumbo hike amid repeated Fedspeak alerting that there was more tightening to come. Fed Vice Chair Lael Brainard last Friday was the most recent, and gave no sign of any temptation to relent: Monetary policy will need to be restrictive for some time to have confidence that inflation is moving back to target. For these reasons, we are committed to avoiding pulling back prematurely… It will take time for the full effect of tighter financial conditions to work through different sectors and to bring inflation down.
As of the end of August, the global central bank rate climbed to 2.97% based on NDR's calculation, the highest level in the post-Global Financial Crisis period though well below the roughly 5% peak seen in 2001 and 2007. For now, the rate is simply mildly restrictive for global growth; but given the 4.00% expectation by early next year, NDR suggests things might take a turn for the worse. This would put the rate in the most restrictive mode for the global economy, increasing the risk of severe global recession. As we've noted numerous times in the past, severe recessions are usually associated with more pronounced equity bear markets.
The chances of a soft landing have all but evaporated in the eyes of many investors, with several preparing themselves for a deep recession. For the last 20 years, NDR shows that widespread rate hikes have, as theory might predict, acted as early indicators of a global growth slowdown, as proxied by Global Manufacturing PMI. We should expect tightening on this scale to be followed by a slowdown — which, after all, is what the central banks are trying to achieve: 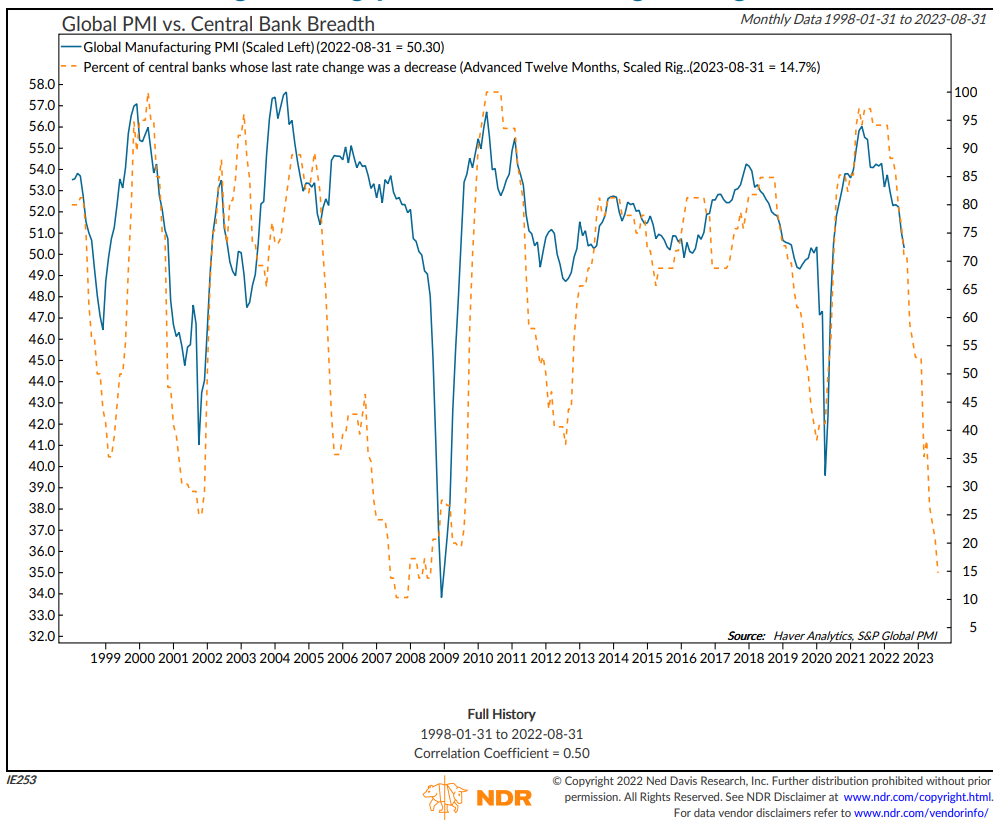 Ned Davis Research All else considered, everyone knows the tightening will end — the question is when. For many, a pivot or a pause will transpire only when evidence of cooling inflation solidifies. Given the continued strength in the PCE index, policymakers may have to be persistent. — Isabelle Lee The economy is not as yet giving the Fed a compelling case to stop hiking, let alone pivot. But there is another outcome that might force a reversal: a financial crisis. If a systemically important institution fails as a result of the pressure from rising interest rates, then central banks have no choice but to relent. Otherwise, as everyone learned after the implosion of Lehman Brothers in 2008, the consequences can be too awful to contemplate. The Bank of England's intervention last week in the face of systemic problems for UK pension funds' derivative positions provided a test run for what this could be like. The BOE hasn't U-turned on rates, which are likely to rise much more; but the advertised intention to start selling bonds has been postponed as it instead buys them to relieve the pressure on pension funds. Such an outcome has been the greatest fear of many in financial markets ever since central banks first intervened to buy bonds after Lehman. After staying so low for so long, prompting institutions into all kinds of deals that would look dangerous at higher rates, what systemic damage could fast-rising bond yields do? So it is certainly not unreasonable to worry about such a scenario. That explains the intense speculation about Credit Suisse that led to the release of a memo from its chief executive officer, Ulrich Koerner, on Friday. The key section reads as follows: I know it's not easy to remain focused amid the many stories you read in the media – in particular, given the many factually inaccurate statements being made. That said, I trust that you are not confusing our day-to-day stock price performance with the strong capital base and liquidity position of the bank.
It's never healthy when a CEO has to offer reassurance like this. But it's certainly true that the day-to-day stock price performance implies great concern. This is what has happened to the price/book multiples payable for the shares of Credit Suisse Group AG and Deutsche Bank AG (which has suffered from several bouts of speculation) over the last 20 years. When investors value a bank at less than its book value (its assets minus liabilities), it implies lack of confidence in the worth of those assets. Deutsche Bank and Credit Suisse are both now trading at less than 25% of their book value, but Credit Suisse has set a new low (unlike Deutsche), and for the first time since before 2008 now has lower book multiple: 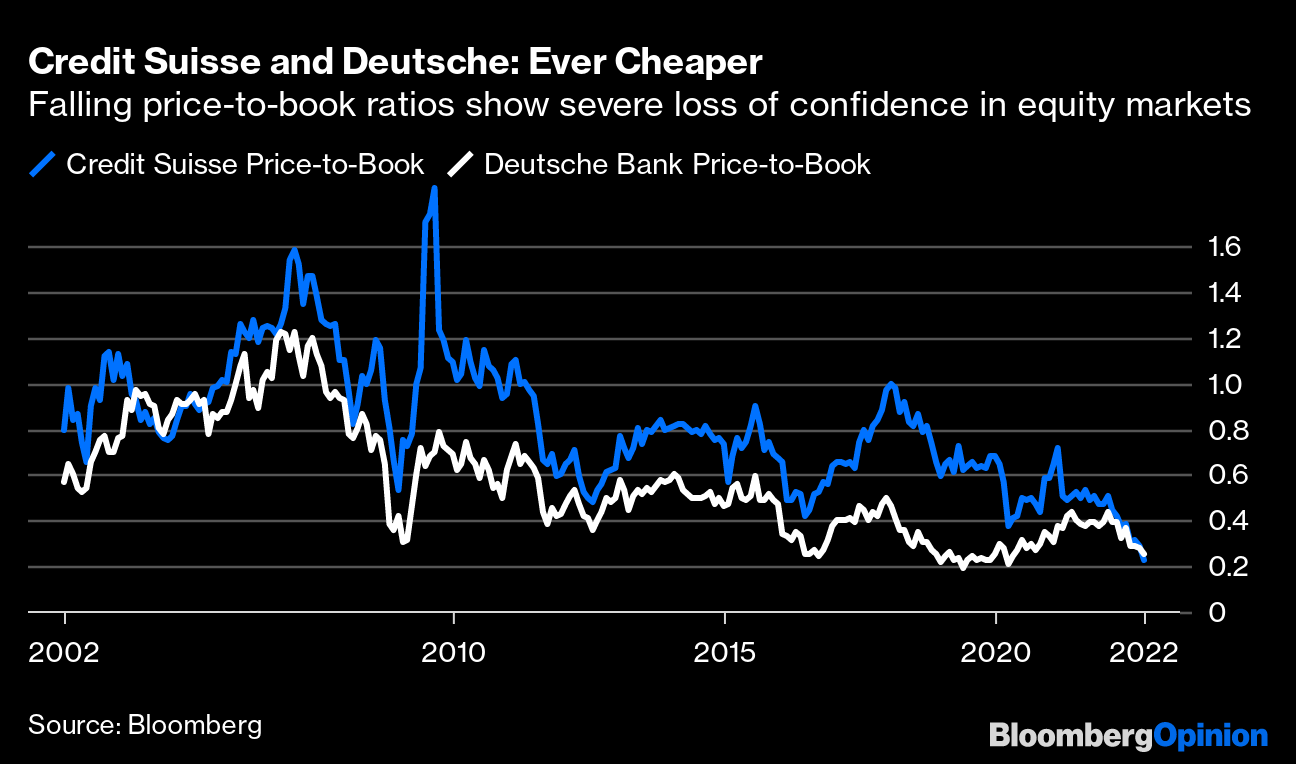 Turning to credit default swaps, an instrument that many of us got to know and dislike in 2008, the picture again looks grim for Credit Suisse. Higher numbers can be viewed as higher premiums for buying insurance against a default. Back in 2009, UBS Group AG was thought to be in a very tenuous situation, while confidence in Credit Suisse was relatively unaffected. Now, Credit Suisse's CDS has risen to levels to match anything that hit it in the post-Lehman era, and it now far exceeds the implicit default risk of UBS. Debt and share prices like this only make sense if these is a significant move in both the equity and credit markets to position for the risk of a default by Credit Suisse. Any such event would open the possibility of Lehman-style damage: 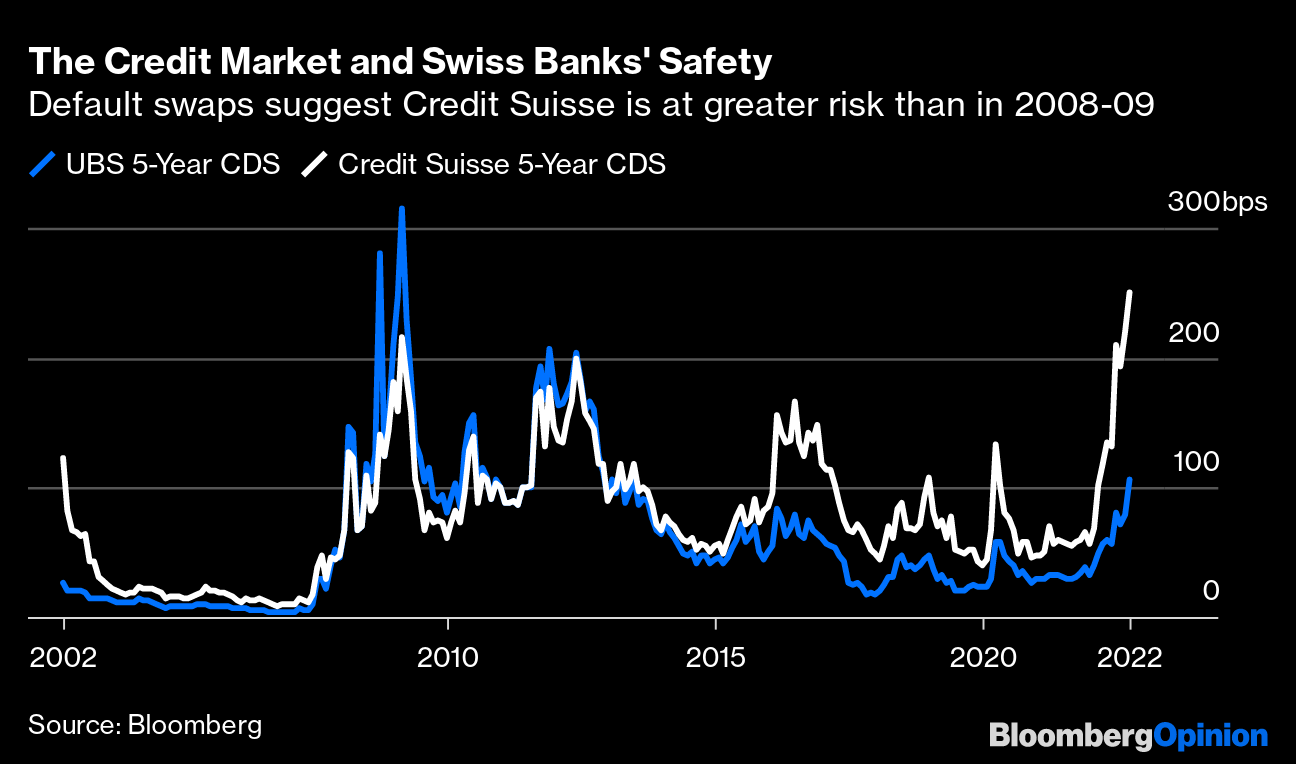 What is strange is that while this is obviously taking a serious toll on Credit Suisse itself, as indicated by Koerner's reassurances, the speculation hasn't had a similar impact on the broader market. Yes, equities are having a bad year, but if we look at the VIX and VStoxx indexes that measure fear in the US and European markets respectively by assessing bets on future equity prices in the options markets, we find that the anxiety doesn't look so great: 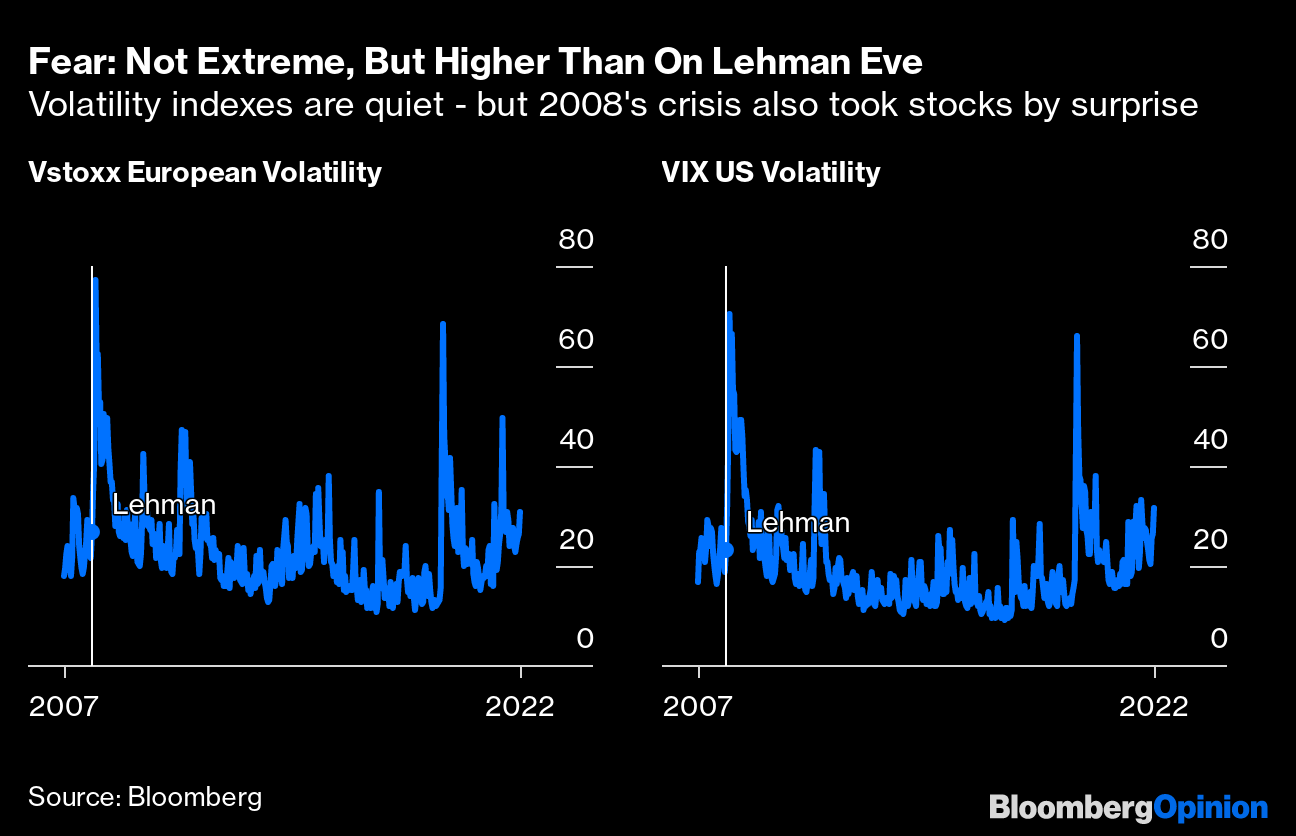 Now comes a sting in the tail. When Lehman Brothers was on the precipice in September 2008, everyone knew about it, and nobody in Wall Street could talk of anything else. I wrote a column on Friday 12th saying that the entire long-term prospect for financial markets could be totally different depending on whether Lehman was still trading at the end of the weekend. Its bankruptcy on Monday 15th duly passed into financial history. Credit Suisse is not creating anything like the angst we experienced then; it's just not comparable. But to my surprise, when I checked, both the VIX and the Vstoxx closed that Friday in 2008 at a slightly lower level than at the end of last week. Despite everything that had already happened, equity investors were still not acting in any great way to protect themselves. What to make of this? I haven't done any research into Credit Suisse's balance sheet myself. I don't want to raise irresponsible speculation that could damage a hugely important institution. However, it's impossible to ignore the extremely tangible moves that have already happened in the market. The fact that credit and equity markets have turned against a big bank to this extent is very significant, and shows that concern about a possible major accident is real and rising. In my opinion, the scenario of a bankruptcy would be so damaging that it could not be allowed to happen; a bailout that marks another huge reverse for tighter money, however, is conceivable. A scenario in which the authorities decide that their best policy is allowing inflation to inflate the banks' problems away could yet happen, and it wouldn't be pretty. Social media speculation is one of the curses of our age. A little more than a week ago, rumors of a coup against President Xi Jinping in China trended on Twitter. Had it been true (it wasn't), such a story would have been immense. Similarly, Lehman is impossible to forget, and unavoidably colors perceptions. Twitter is full of blood-curdling illustrations of how bad it would be if Credit Suisse were to fail. These are correct; it would be terrible. But the Twitter posts have little or no evidence that it's going to happen. If Credit Suisse doesn't need a bailout, as the CEO's memo endeavors to show, then all the talk has left it very much oversold and its stock looks a buy. The courage it would require to buy into it at this moment, however, shows why there is so much money to be made from buying at the bottom; it's a difficult thing to do. The results of the first round of Brazil's presidential elections are in, and Luiz Inacio Lula da Silva (universally known as Lula) has a clear (but narrower than expected) lead over the incumbent, Jair Bolsonaro, to set up what could be a very tight runoff in two weeks. It's a fascinating contest to which Points of Return will doubtless have to return. For now, just a positive reminder amid the gloom that Lula, a veteran left-wing union leader, utterly terrified international markets ahead of his first election as president in October 2002. That terror, followed by his surprising pragmatism in office and a global commodity boom that did wonders for the Brazilian economy, created what I would nominate as the greatest buying opportunity ever. Buying the Bovespa index on the day Lula won and holding until a peak at May 30, 2008, just ahead of the crisis, would have earned you a staggering 1,963% in dollar terms (equivalent to an annualized return of 66%). To emphasize how good this was, a trade of buying the Bovespa relative to the MSCI all-world index (which would have involved shorting global equities as they went into a five-year bull run), would have yielded 1,074% (or 36.2%) annualized by Brazil's relative peak on Oct. 5, 2010 — which by weird coincidence was when Brazilians went to the polls to select Lula's successor. All kinds of horrible things have gone wrong for Brazil, and for Lula, since then. But if ever there was a spectacular example that you should be greedy when others are fearful, Lula provided it. In the meantime, while we await the runoff, you might watch a particularly scabrous John Oliver report on the possibility that Bolsonaro refuses to accept a defeat; or you could watch some Brazilians playing football. They're very, very good at it. Examples include their World Cup victories in 1958, 1962, 1970, 1994, and 2002, and perhaps above all their glorious failure in 1982. It's wonderful to behold. Have a good week everyone.
Like Bloomberg's Points of Return? Subscribe for unlimited access to trusted, data-based journalism in 120 countries around the world and gain expert analysis from exclusive daily newsletters, The Bloomberg Open and The Bloomberg Close. More From Bloomberg Opinion: Want more Bloomberg Opinion? OPIN <GO>. | 


No comments:
Post a Comment