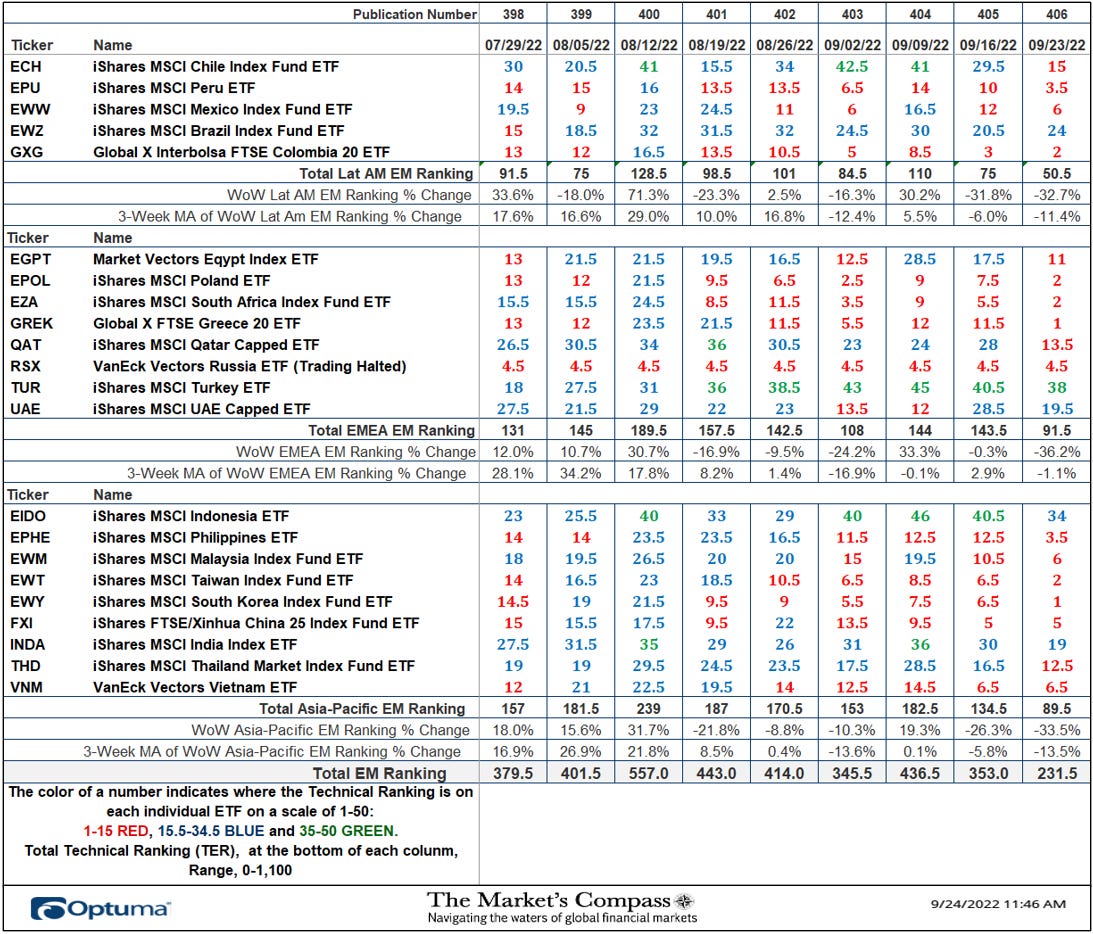
Welcome to this week’s Market’s Compass Emerging Market’s Country ETF Study Excerpt, Week #406, that is being published in my Substack Blog. It will highlight the technical changes of the 22 EM Country ETFs that I track on a weekly basis and publish every third week. Paid subscribers will continue to receive the Weekly ETF Studies sent directly to their registered email. Free subscribers will receive this abridged excerpt. Past publications also can be accessed by paid subscribers via The Market’s Compass Substack Blog. Next week we will be publishing the The Market’s Compass US Index and Sector ETF Study. Last Week’s and 8 Week Trailing Technical Rankings of the Individual EM ETFs The Excel spreadsheet below indicates the weekly change in the Technical Ranking (“TR”) of each individual ETF. The technical ranking or scoring system is an entirely quantitative approach that utilizes multiple technical considerations that include but are not limited to trend, momentum, measurements of accumulation/distribution and relative strength. If an individual ETFs technical condition improves the Technical Ranking TR rises and conversely if the technical condition continues to deteriorate the TR falls. The TR of each individual ETF ranges from 0 to 50. The primary take away from this spread sheet should be the trend of the individual TRs either the continued improvement or deterioration, as well as a change in direction. Secondarily, a very low ranking can signal an oversold condition and conversely a continued very high number can be viewed as an overbought condition, but with due warning, over sold conditions can continue at apace and overbought securities that have exhibited extraordinary momentum can easily become more overbought. A sustained trend change needs to unfold in the TR for it to be actionable. The TR of each individual ETF in each of the three geographic regions can also reveal comparative relative strength or weakness of the technical condition of the select ETFs in the same region.
The largest loss in the three EM Region Total Rankings since we last published on September 5th for the week ending September 2nd was in the Asia Pacific region which has fallen -41.50% to 89.5 from the 153 registered four weeks ago. That is followed by a slightly lesser loss of -40.24% in the Lat AM Region Total Technical Ranking which fell to 50.5 from 84.5 over the same period and a -15.28% drop in the EMEA Total Technical Ranking to 91.5 from 108. The Total EM Technical Ranking fallen -33.10% to 231.5 from 345.5. The Week Over Week Change in Individual Technical Rankings
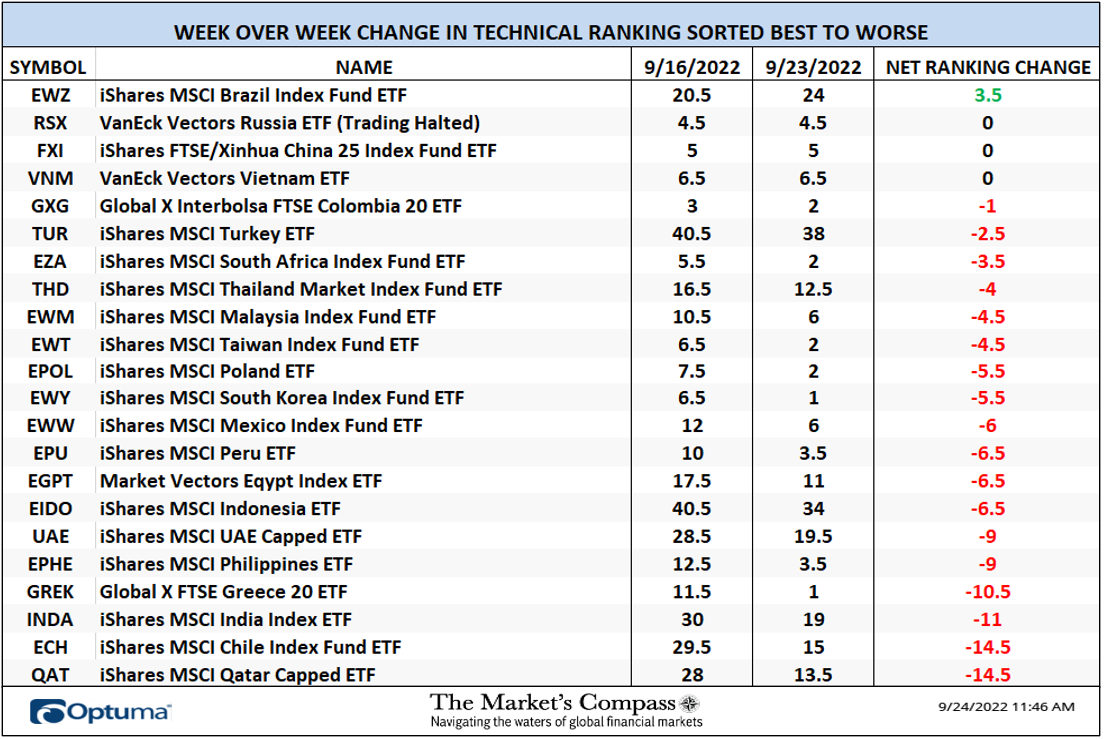
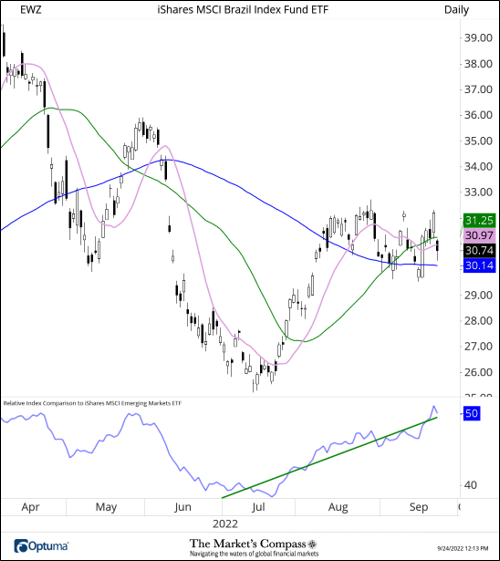
Only one EM Country ETF registered an improvement in its individual Technical Ranking (“TR”) two were unchanged (excludes the VanEck Vectors Russia ETF (RSX) where trading has been halted for months) and eighteen saw their TRs fall. The average TR loss over the week was -5.52. The only TR gain was in the iShares MSCI Brazil Index Fund ETF (EWZ) whose TR rose by 3 “handles” to 24 from 20.5. This is only noteworthy because of the deterioration in the TRs of the other ETFs. I have posted a daily chart of the EWZ below with an added panel below the price chart of the EWZ’s relative strength vs. the EEM. The positive relative strength since the start of July is highlighted with a linear regression line in green whose vector additionally confirms the outperformance.
© 2022 The Market's Compass
|
Monday, September 26, 2022
The Market's Compass Emerging Markets Country ETF Study Excerpt
Subscribe to:
Post Comments (Atom)
-
La minute d'inspiration de BE A BOSS pour les BOSS Pensez à ajouter cette adress...
-
L'actualité des BeaBoss chaque jour Pensez à ajouter cette adresse à votre carnet...
-
L'actualité des BeaBoss chaque jour Pensez à ajouter cette adresse à votre carnet...


No comments:
Post a Comment