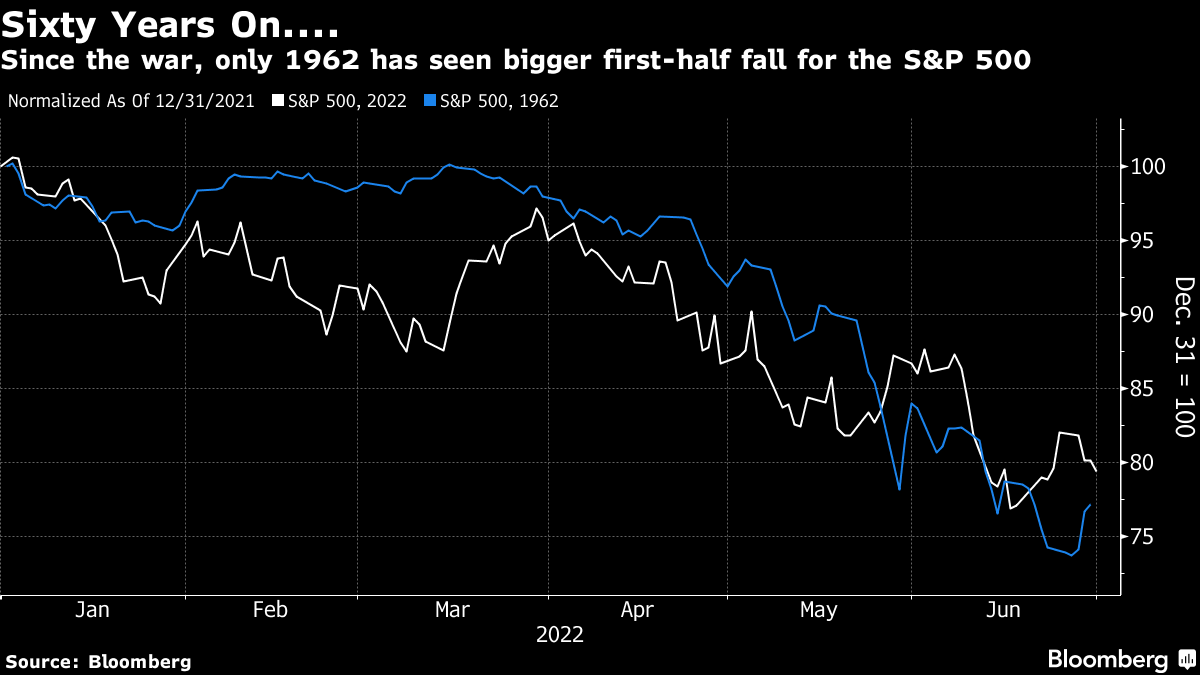
| The stock market — the daytime adventure serial of the well-to-do — wouldn't be the stock market if it didn't have its ups and downs. Anyone knows that the elder J.P. Morgan, when asked to predict the market, said: "It will fluctuate." That is how John Brooks chose to start his book Business Adventures. Now something of a classic, Warren Buffett is on record as saying it is his favorite book about finance. It starts by telling the story of 1962, when the US stock market suffered its worst selloff since the Great Crash of 1929. Little remembered, the crash of 1962 now has a fresh distinction. This year's first half, thankfully over, has been the worst start for stocks since the war — except for 1962. This is how the two years compare: Can history be any guide? In 1962, the bottom was hit in late June, and anyone buying then would have made 15% by the end of the year. However, they would have had to wait for the peaceful resolution of the Cuban missile crisis before the market made a convincing recovery. Overall, it was still a bad year, with the S&P shedding 11%. Worries about nuclear conflict have probably been canvassed more in 2022 than in any of the 60 years since, which helps explain the backdrop of low confidence. There's much appeal in the suggestion by my colleague Kriti Gupta that we might have to wait for some clear settlement to the Ukraine conflict before there is any durable recovery — just as markets needed to know that Kennedy and Khrushchev had stepped back from the brink before stocks rallied 60 years ago. Then as now, price declines were led by falling multiples, which had started at an over-expensive level. As the chart shows, the two years look startlingly similar in this respect. Encouragingly, the S&P 500's price-earnings ratio hit a low on June 29 in 1962. Less encouragingly, the tumble 60 years ago looked much more like a cathartic end to speculative excess, thanks in large part to a true crash in late May. Despite everything, there's no such clear catharsis this time. Indeed, the exercise if anything suggests that the definitive decline still lies ahead — markets tend not to crash from a high, but when they have already clearly started to head down. Valuation isn't as excessive as it was, for sure; but it's hard to argue that it's now at a robust sustainable level: 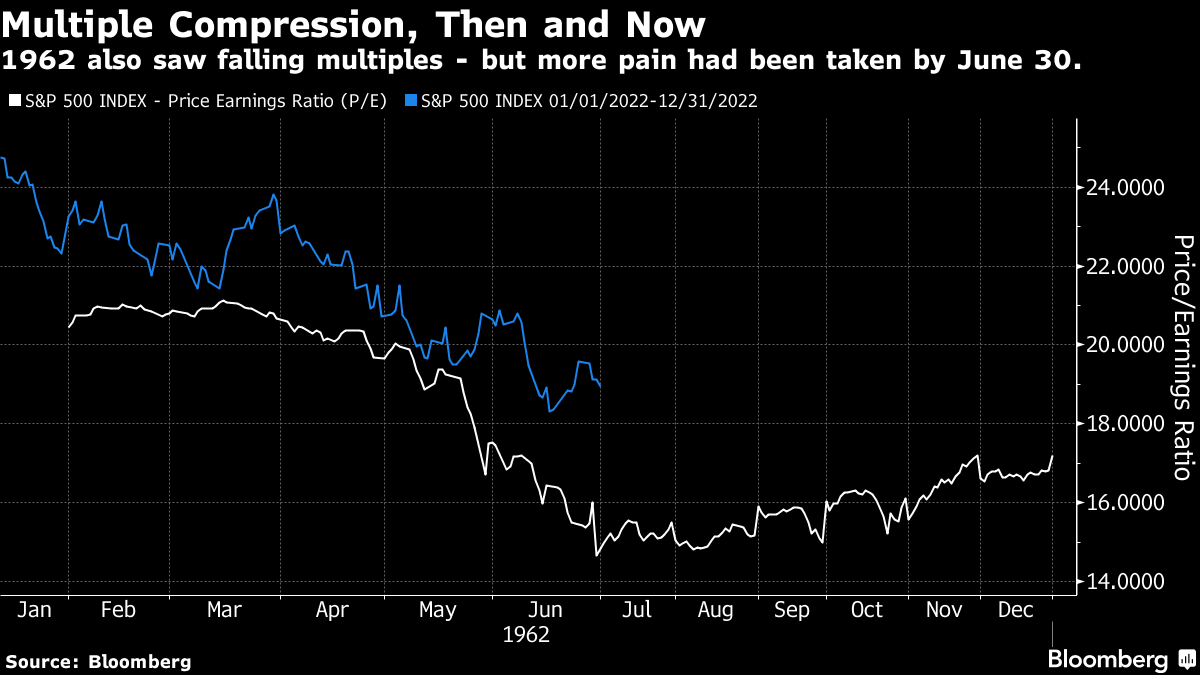 If multiple compression still has a way to go, the question of earnings is more insistent. P/Es are backward-looking, while prospective P/Es tell much the same story and are based on forecasts that currently look rosy. In 1962, profits proved robust; that might happen again, but it's probably the most important question hanging over stock markets. Broader historical parallels are intriguing. Brooks, writing half a century ago, went out of his way to explain just how technologically advanced and vast the US stock market had become: By a heaven-sent stroke of prescience, Merrill Lynch, which handled over thirteen per cent of all public trading on the Exchange, had just installed a new 7074 computer — the device that can copy the telephone directory in three minutes — and, with its help, managed to keeps accounts fairly straight. Another new Merrill Lynch installation — an automatic teletype switching system that occupied almost half a city block and was intended to expedite communication between the firm's various offices — also rose to the occasion, though it got so hot that it could not be touched. Along with panic came near chaos. Whatever else may be said about Tuesday, May 29th, it will be long remembered as the day when there was something very close to a complete breakdown of the reticulated, automated, mind-boggling complex of technical facilities that made nationwide stock-trading possible in a huge country where nearly one of out of six adults was a stockholder. Many orders were executed at prices far different from the ones agreed to by the customers placing the orders; many others were lost in transmission, or in the snow of scrap paper covered the exchange floor, and were never executed at all. Sometimes brokerage firms were prevented from executing orders by simple inability to get in touch with their floor men.
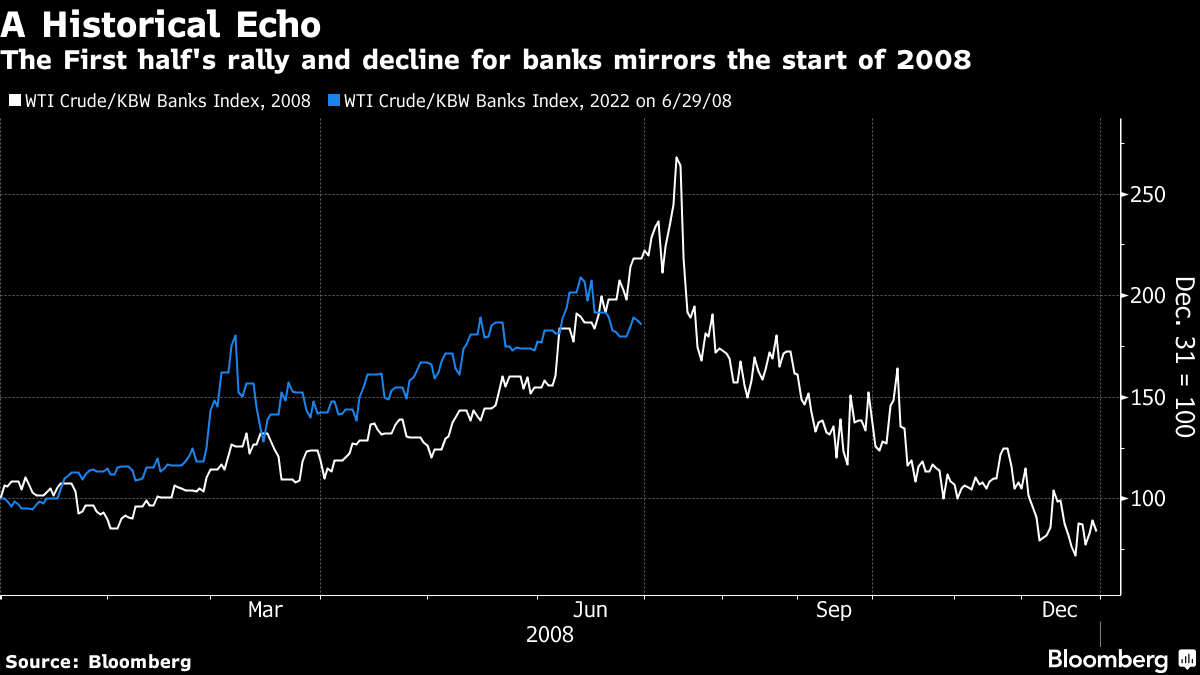
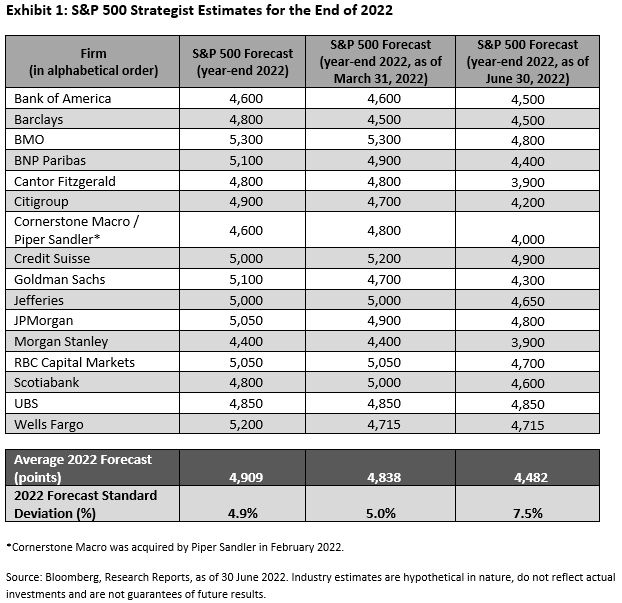
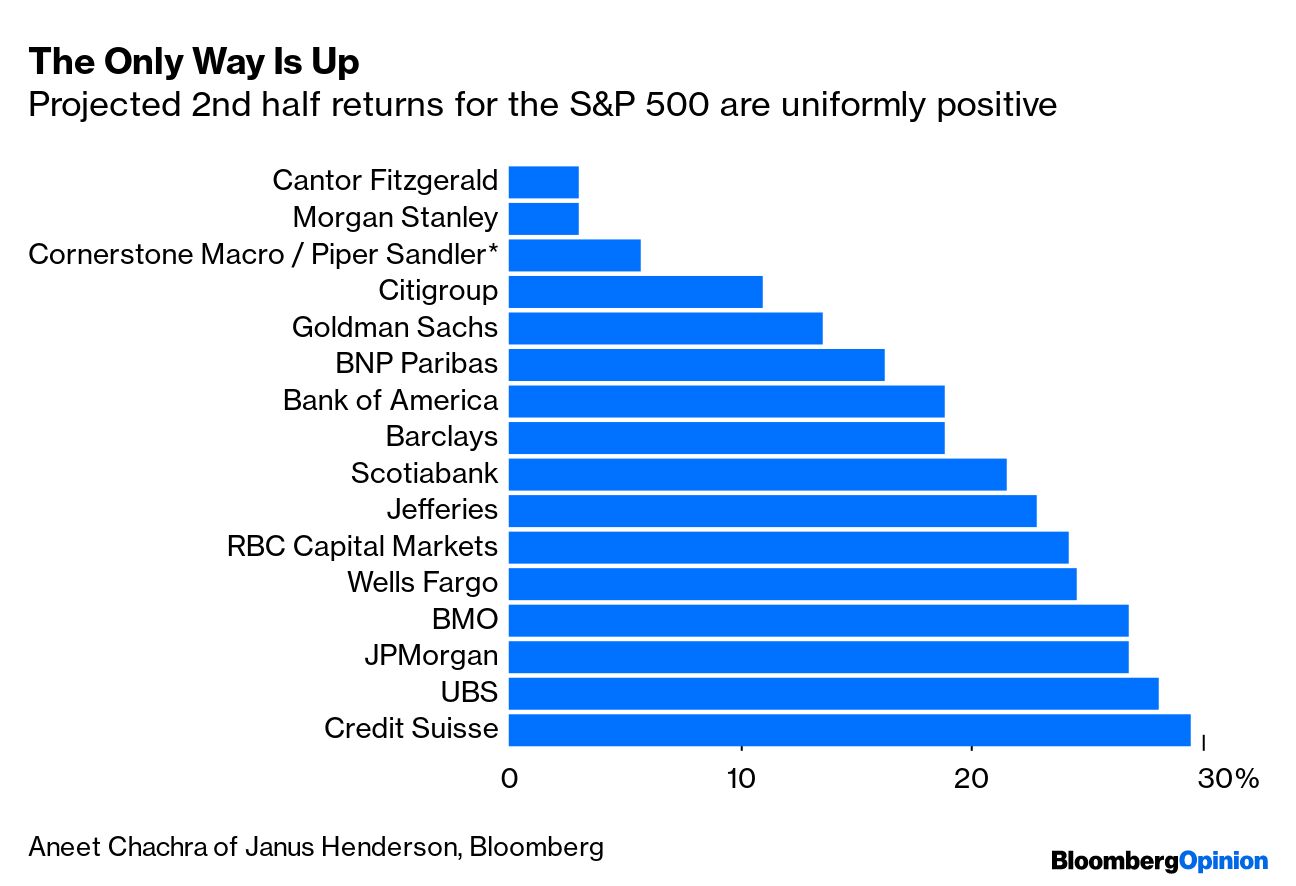
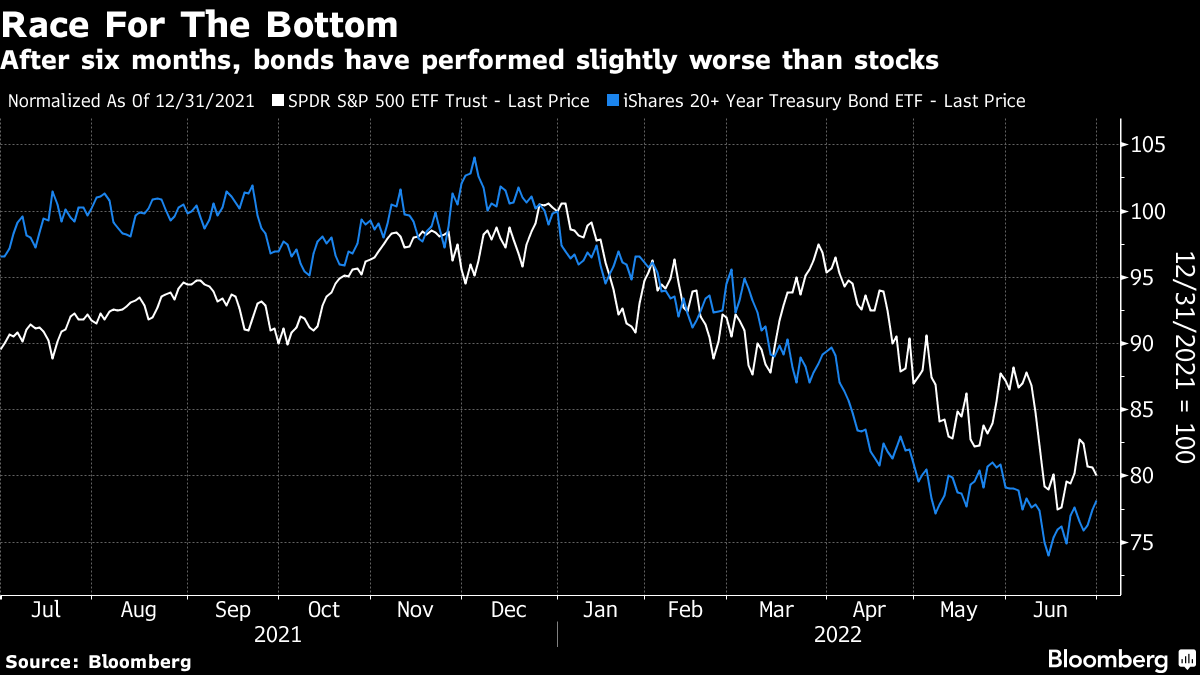
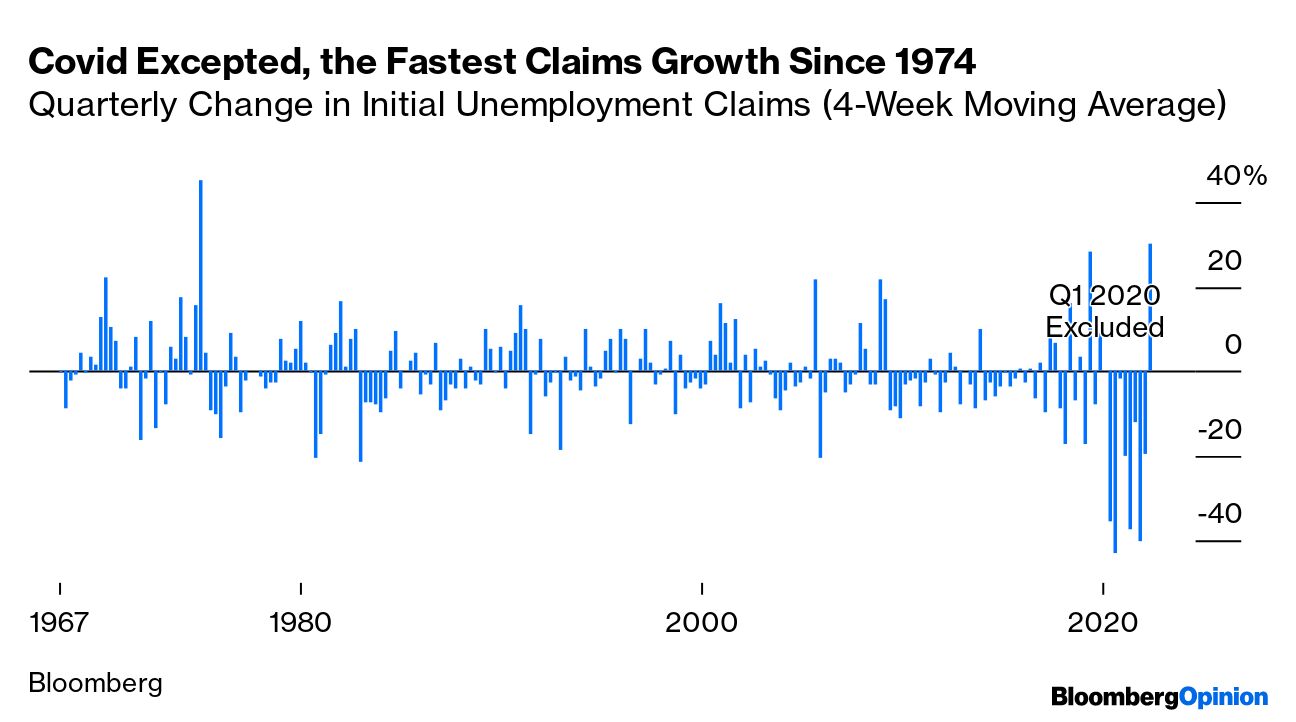
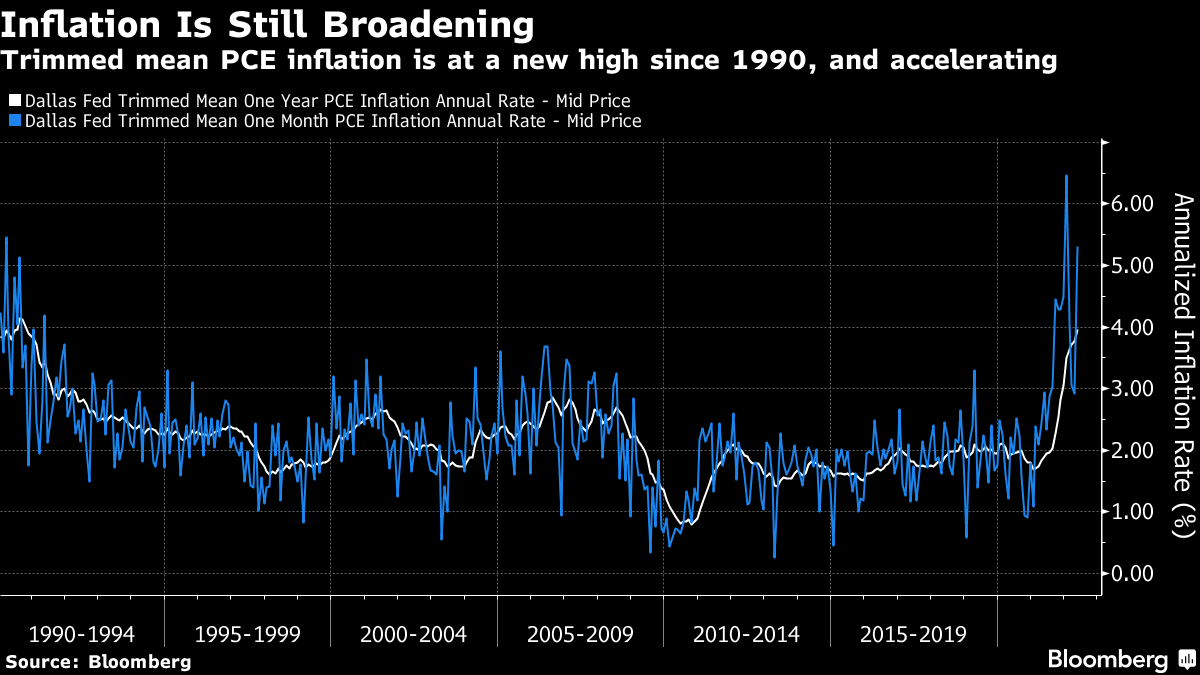
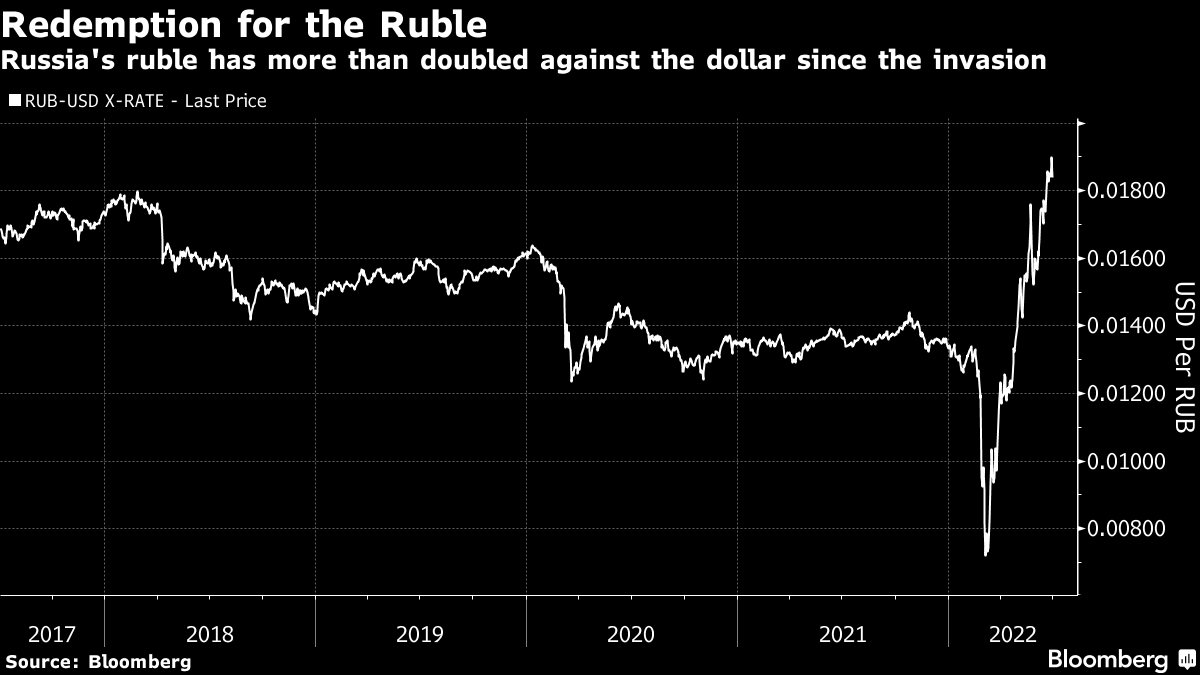
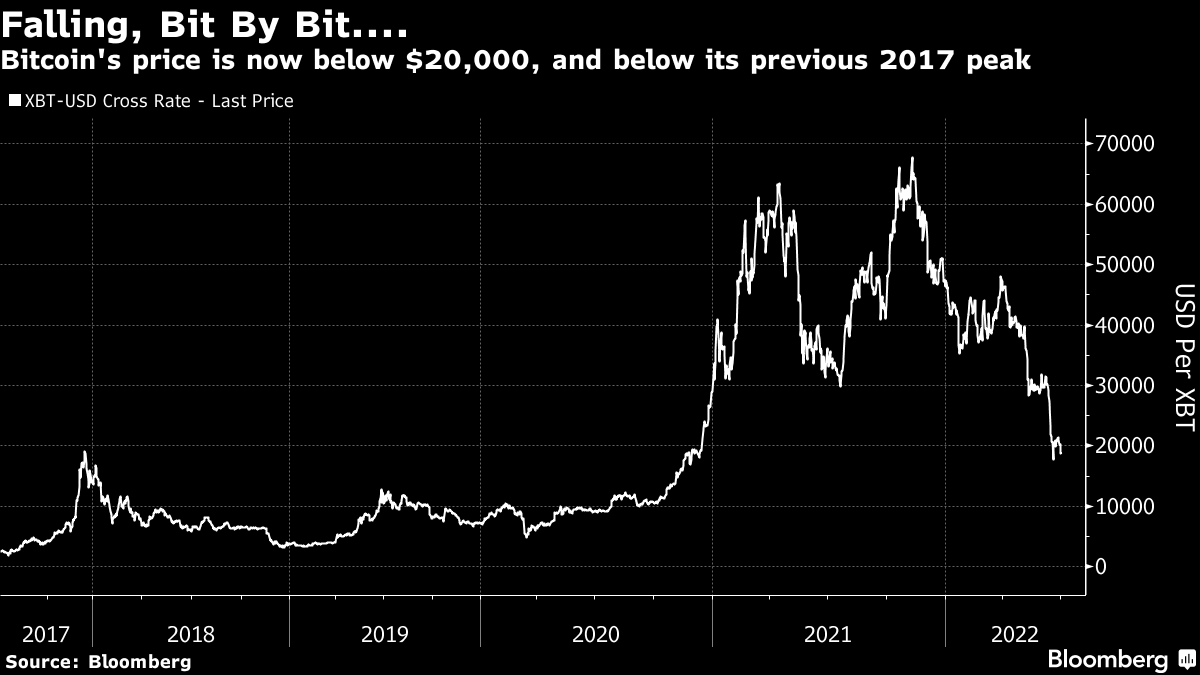
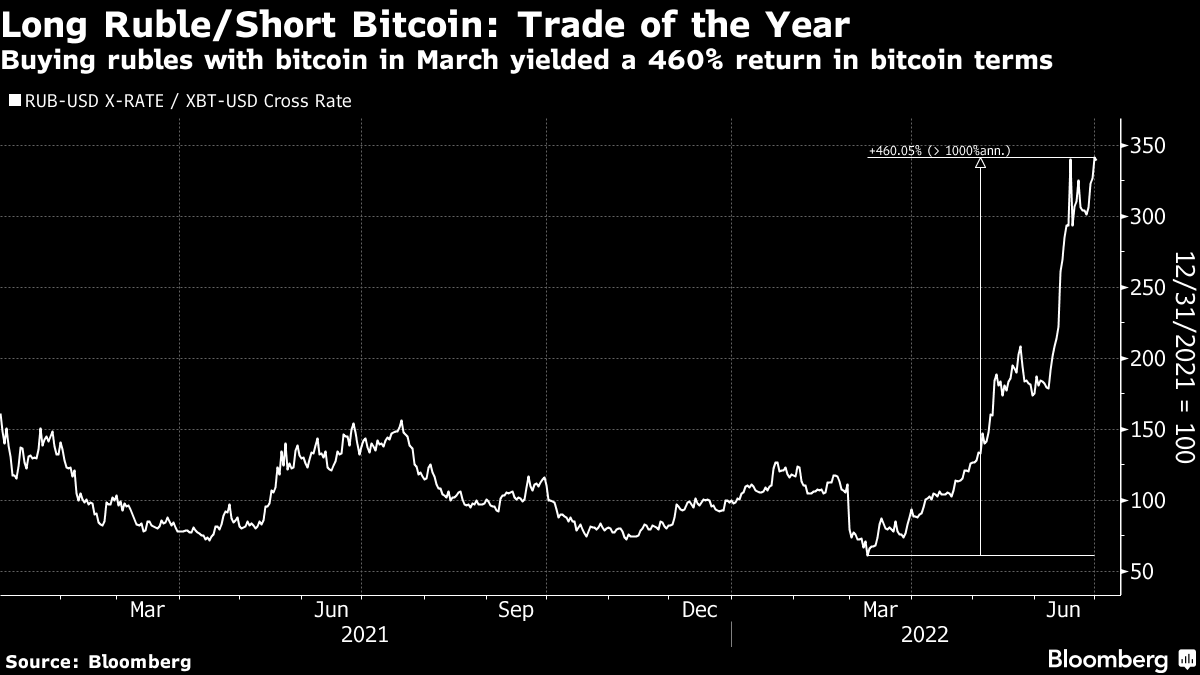
This was how trading was done then. The critical problem was with the tape — as in the physical paper tape that recorded all stock trades — which was already 56 minutes late by 12:45 p.m. on that fateful day, when the market hit bottom and turned. Therefore, "the ticker was engaged in informing the stock market community of a selling panic at a moment when what was actually in progress was a buying panic." Fast forward, however, and the concerns are similar. In 1962, there was concern over margin calls, and over the risks that holders of mutual funds, a new-fangled instrument gaining in popularity, might all sell and create a downward spiral. This seems very similar to worries about ETFs now. Then, the greatest concerns were whether the technological infrastructure and innovative financial instruments would work when put under pressure. They came through the test 60 years ago. Today's technology is far more advanced, but so are the demands. The question remains the same: Will the market infrastructure be able to deal with what lies ahead, or will it buckle and create a far worse crisis? Meanwhile, there's another historical echo that I find disquieting. One of the best trades this year has been to bet against banks while pouring money into oil. This is pursuing the narrative that inflation and higher rates will pummel banks and the rest of the financial system, while there is money to be made from sticking with the boom in commodities. A trade of going long WTI oil futures while shorting the KBW index of big US banks would have almost exactly doubled your money. What worries me is that this is an almost perfect repeat of 2008, the year of the Lehman Brothers bankruptcy. At this point then, the long oil/short banks trade had done even better (although 2022 did outpace it for five months). The top lasted another two weeks as oil hit a record that still stands. Then, as the chart shows, the trade collapsed spectacularly. Oil fell so far that by the end of the year it had underperformed bank shares: No particular news sparked the end. The trade just collapsed under the weight of its own contradictions. If financial conditions were bad enough to push banks into crisis, there couldn't possibly be enough demand to sustain a record oil price. This time around, the Russian invasion of Ukraine provided a clearer justification for rising oil prices. But the same arguments hold. Higher oil prices can be expected to attract more supply, and to choke off demand. A resolution in Ukraine could well create relief along the lines of the 1962 missile crisis. But it would be really bad for those who've been surviving 2022 by betting on oil and against banks. Should we buy? A range of equity strategists say yes. At the outset, with the S&P 500 close to 4,800, a number were calling for a down year, with Morgan Stanley and Bank of America Corp. the most conspicuously bearish of the big houses. Since then, virtually all have cut forecasts for the year-end (with the exception of UBS Group AG, whose 4,850 prediction remains unchanged). I'm grateful as ever to Aneet Chachra of Janus Henderson Group Plc for putting together the following chart. Estimates are not only reducing, but have also become more dispersed: However, all the strategists Chachra looked at implicitly believe the selloff has now gone far enough. From Thursday's close, all have predictions that involve a gain by the end of the year. Some see profits of almost 30% in six months: Earnings estimates produced by the strategists' colleagues have been widely criticized as unduly optimistic. Overall, profit forecasts for the whole of 2022 remain slightly higher than at the beginning of the year, despite factors such as sharply higher rates and a much less favorable dollar exchange rate. While the tone is negative, top-down strategists are also more optimistic than they seem. Either both top-down and bottom-up Wall Street analysts have slipped behind and will grow more pessimistic as they publish revisions, or there's more reason for confidence than at first appears. It's hard to see this as a major low for sentiment among professional investors. The half ended with an exciting shift in the bond market. Bets are now moving heftily to discount a Fed hiking program that is completed by early next year, followed by a series of cuts that will be well underway by the end of 2023. As a result, bonds rose sharply as stocks sold off. The effect had dissipated by the end of the day. Long bonds, as represented by the TLT exchange-traded fund, had still underperformed stocks (proxied by the SPY ETF) for the year so far. But it was close at the end: If the emerging new consensus is proved right, then this should be a very good time to buy bonds, while stocks should be avoided. Is it right? The latest data do offer some support. US personal spending rose only 0.2% last month, much below expectations. Even though consumers are flush with cash and the economy is reopening, they're still not spending much. Meanwhile, jobless claims continue to rise. Based on the four-week moving average, the second quarter saw greater percentage growth than any since 1974 (with the significant exception of the first quarter of 2020, when Covid drove an increase in claims of more than 800% — I excluded that quarter from the chart below because it would have rendered the whole thing illegible): There are still plenty of stories of labor shortages, and claims are increasing from a low base. But it's what happens at the margin that matters most in economics, and new claims have plainly started to rise again. If this continues, then predictions that the Fed is forced into a U-turn on rates within 12 months could easily be fulfilled. Another data point to cause excitement was the May personal consumption expenditure deflator. On both a monthly and year-on-year basis, PCE avoided increases and came in lower than expected. That also offers support to the notion that the peak for inflation is in at last. Even if inflation remains high, on this argument, the change in direction is the crucial point. I fear this reading may be too optimistic. The Fed sets great store by "trimmed mean" estimates, in which the greatest outliers in either direction are excluded, and an average is taken of the components that remain. For statisticians, there's a good argument that the trimmed mean PCE is the best pure measure of underlying inflationary pressure. The Dallas Fed calculates trimmed mean PCEs over 12 and six months, and one month. The results aren't great: On a year-on-year basis, inflation is its highest since 1990. Month-on-month, it dropped in April, but bounced straight back in May, at a rate equivalent to 5% per year. The measure is below its peak earlier this year, but higher than any other reading since 1990. A year ago, the Dallas Fed measures were popular with what was then known as "Team Transitory"; they showed core inflation staying under control below 2% well into 2021. Now, this measure tells an uglier story. A year ago, the narrative of "Team Non-Transitory" was that extreme price moves would steadily dislodge inflation expectations, and lead to a steady broadening of price pressures. The Dallas Fed numbers, unfortunately, are telling exactly that story. Inflation and the jobs market may be gently pivoting in different directions. But neither is certain yet. The decline in bond yields looks premature. I try to make this newsletter about actionable and sensible ideas. But it's always fun to see what totally absurd and "out there" ideas might have worked. And one of the best trades of the last six months is simply astonishing. Here goes. Contrarian trade of the year so far has to be buying the Russian ruble. Its recovery from the brief disaster caused by the invasion of Ukraine has been phenomenal. This is the number of US dollars needed to buy a ruble over the last five years: If you saw that coming, well done. I certainly didn't. Now let's look at the other eye-catching currency of the last six months: bitcoin. It's less surprising that the leading cryptocurrency has taken losses this year, as it has always been intensely volatile. But the scale of the downturn, just as the crypto complex appeared to be coming of age, has taken many by surprise. Here is bitcoin over the last five years: To make yourself very rich over these difficult last six months, all you needed to do was put these trades together. A short bitcoin/long ruble trade would have moved into orbit since Jan. 1: So if you used bitcoin to buy rubles at the beginning (a profit of almost 250%), or especially if you did so at the ruble's nadir in March (460%), then hats off. Although perhaps I shouldn't be too effusive. Bitcoin and rubles made for a great investment this year, but a sizeable chunk of demand for both is for not totally above-board purposes. That aside, if anyone out there saw the ruble as the big gaining currency of the first half, and also foresaw the crypto meltdown, well done. I'm guessing that this trade won't do quite as well over the next six months, though. America is about to take a break for July 4. It's a great festival. For a range of songs about the great country that gave the rest of the world jazz, the blues, rock 'n' roll and hip-hop, try this fascinating collection for a "more pensive" Independence Day. Or you can enjoy the most glorious piece of music yet to celebrate how America became independent and then built a new country; Lin Manuel Miranda's Hamilton. Have a good weekend everyone, even if you're not one of the ones who celebrate an independent America. More From Other Writers at Bloomberg Opinion: Want more from Bloomberg Opinion? Terminal readers head to {OPIN <GO>}. | 


No comments:
Post a Comment