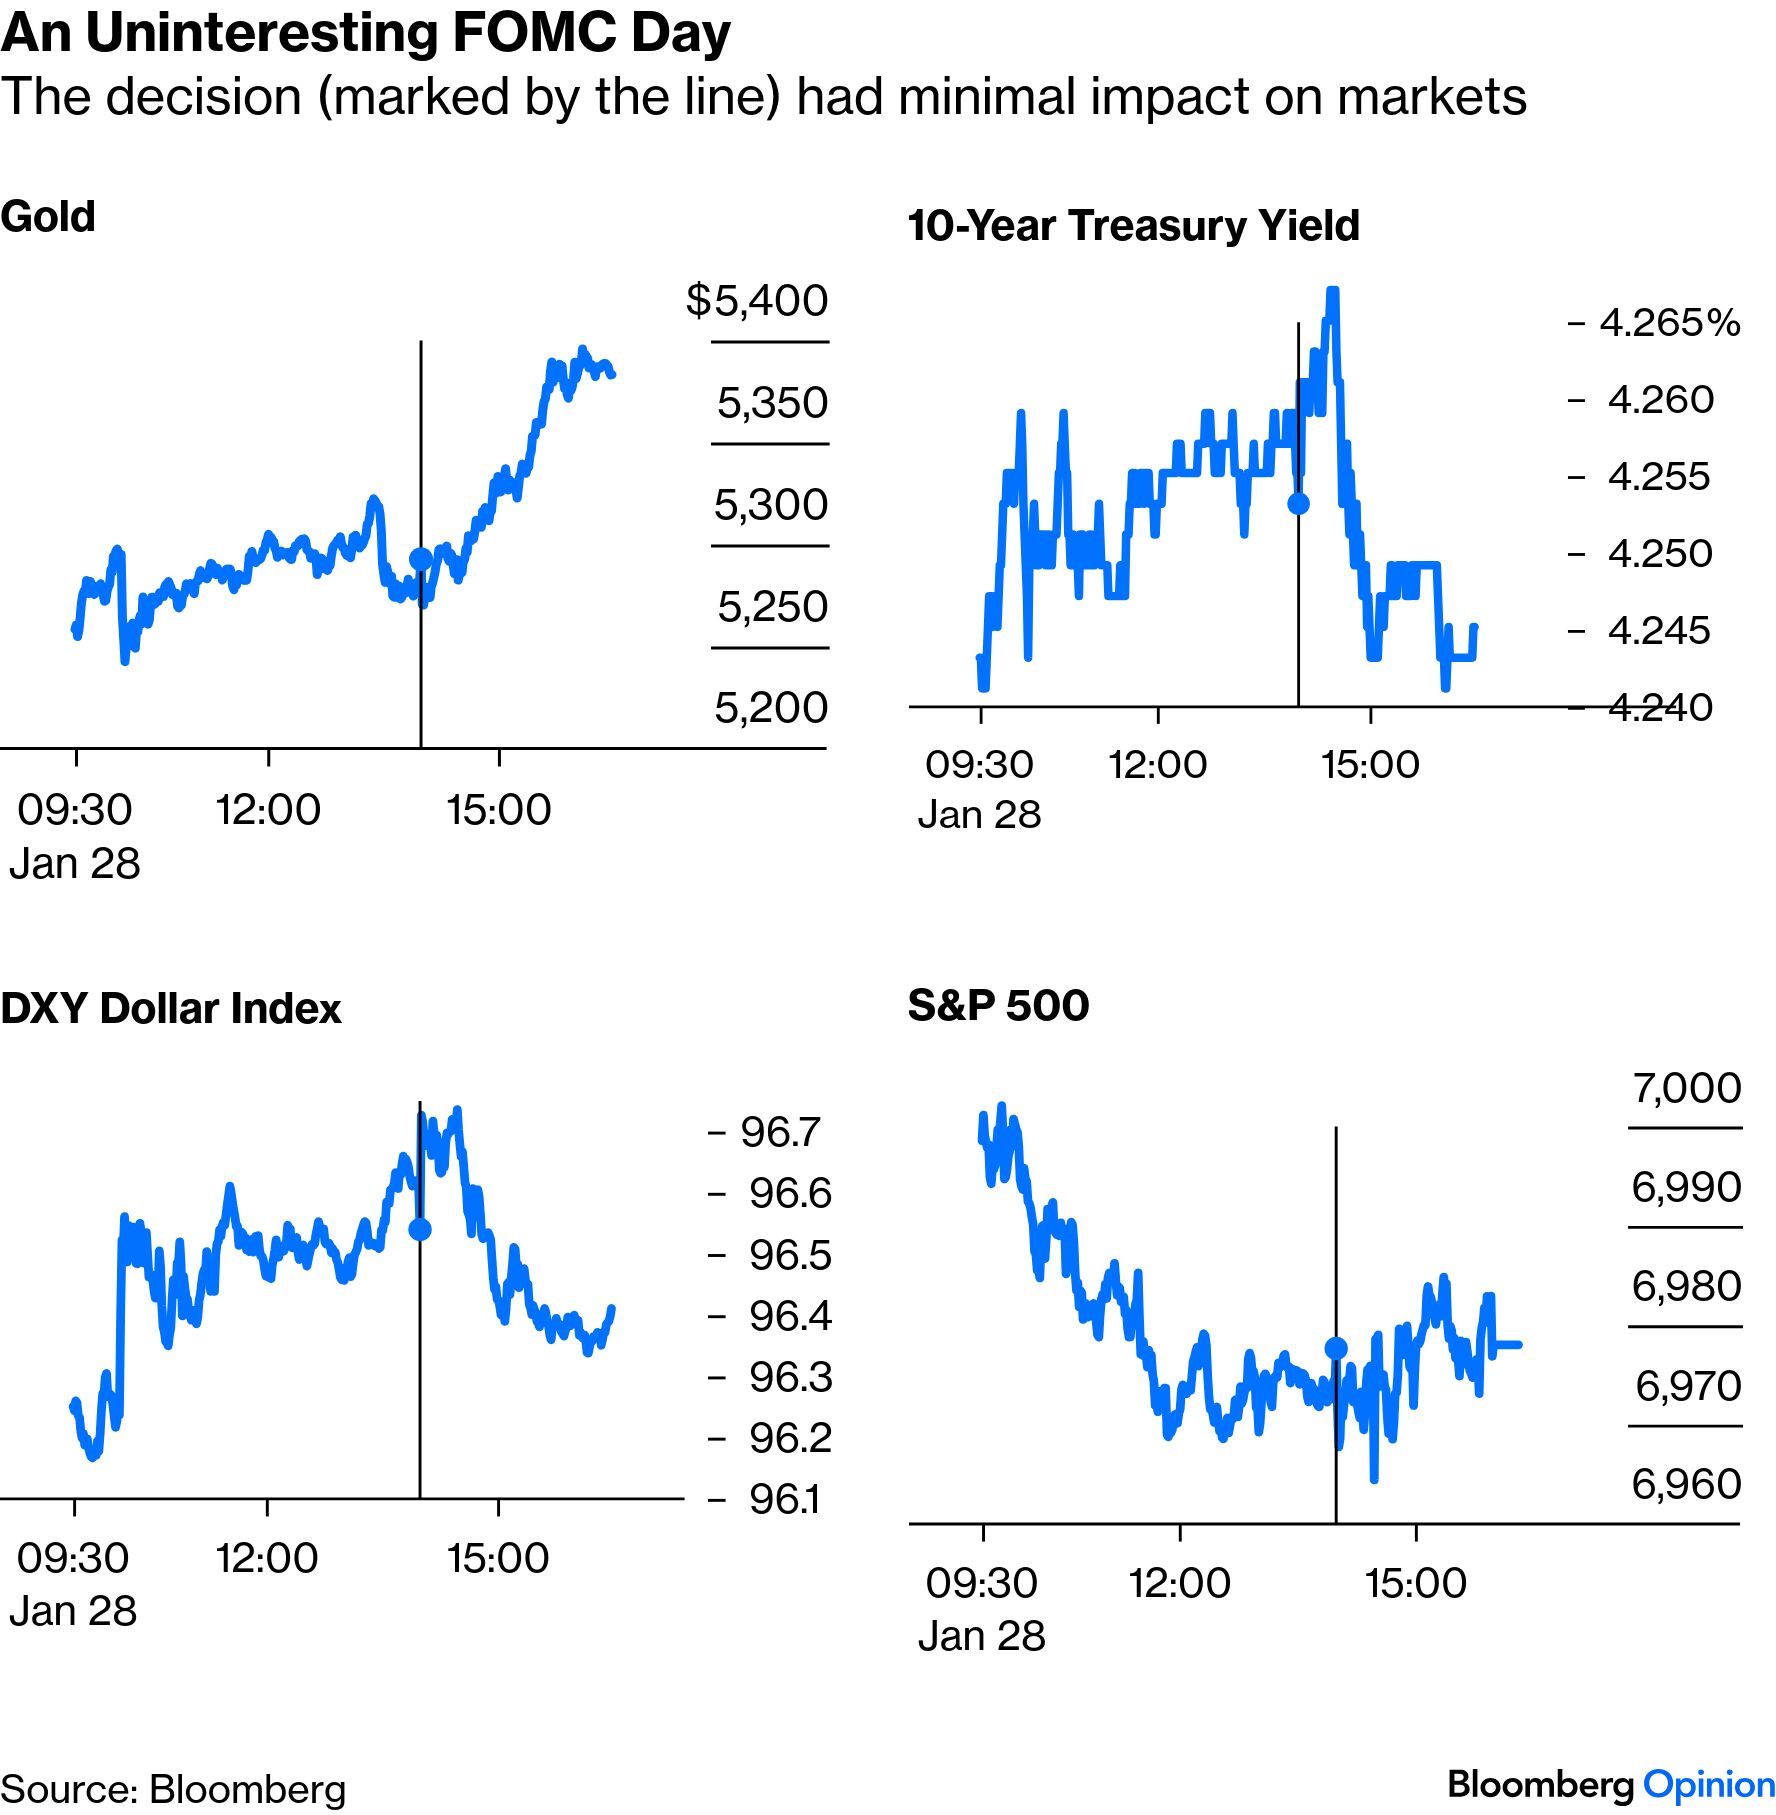
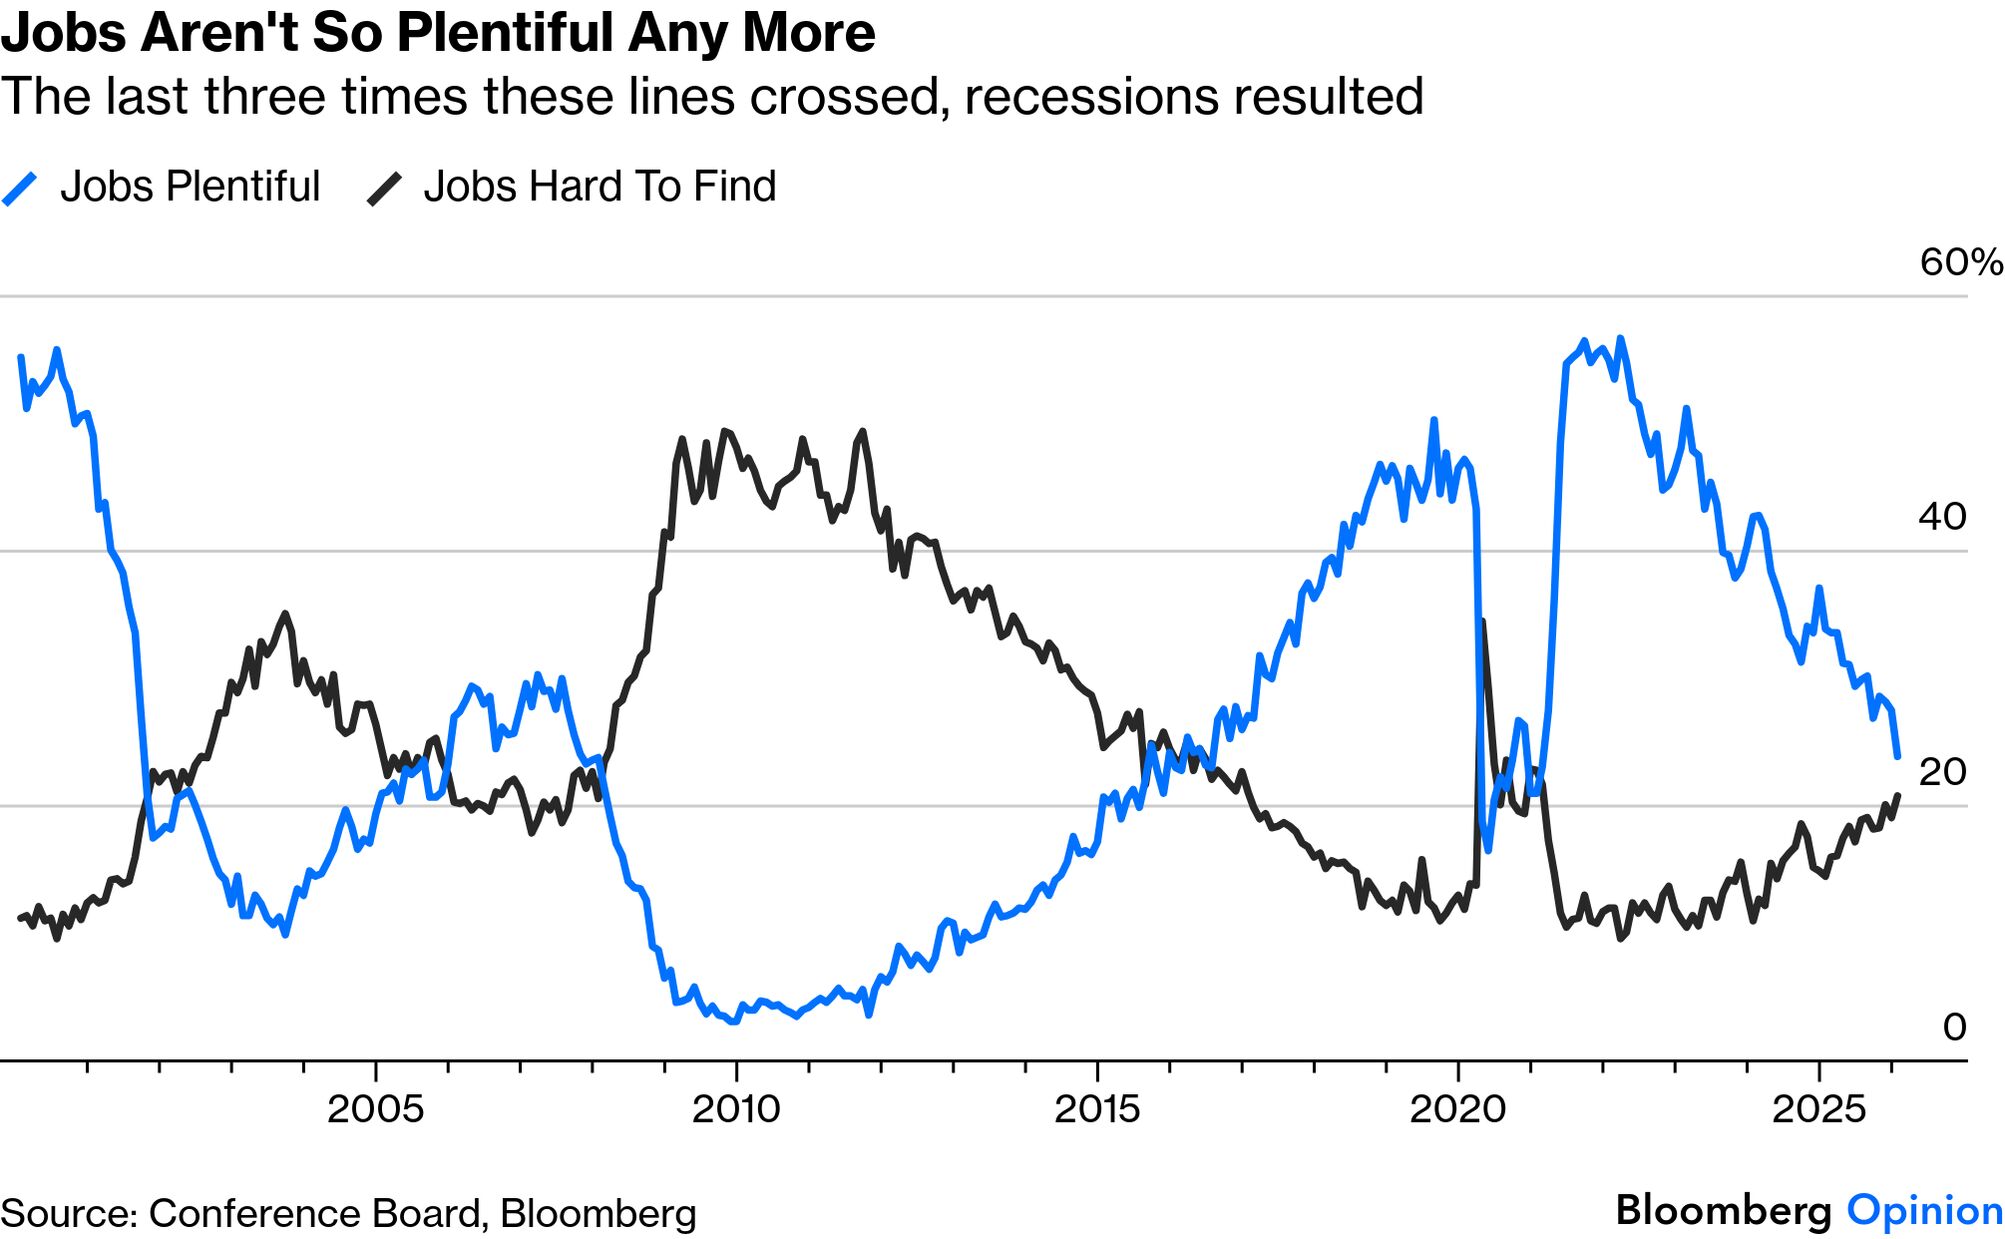
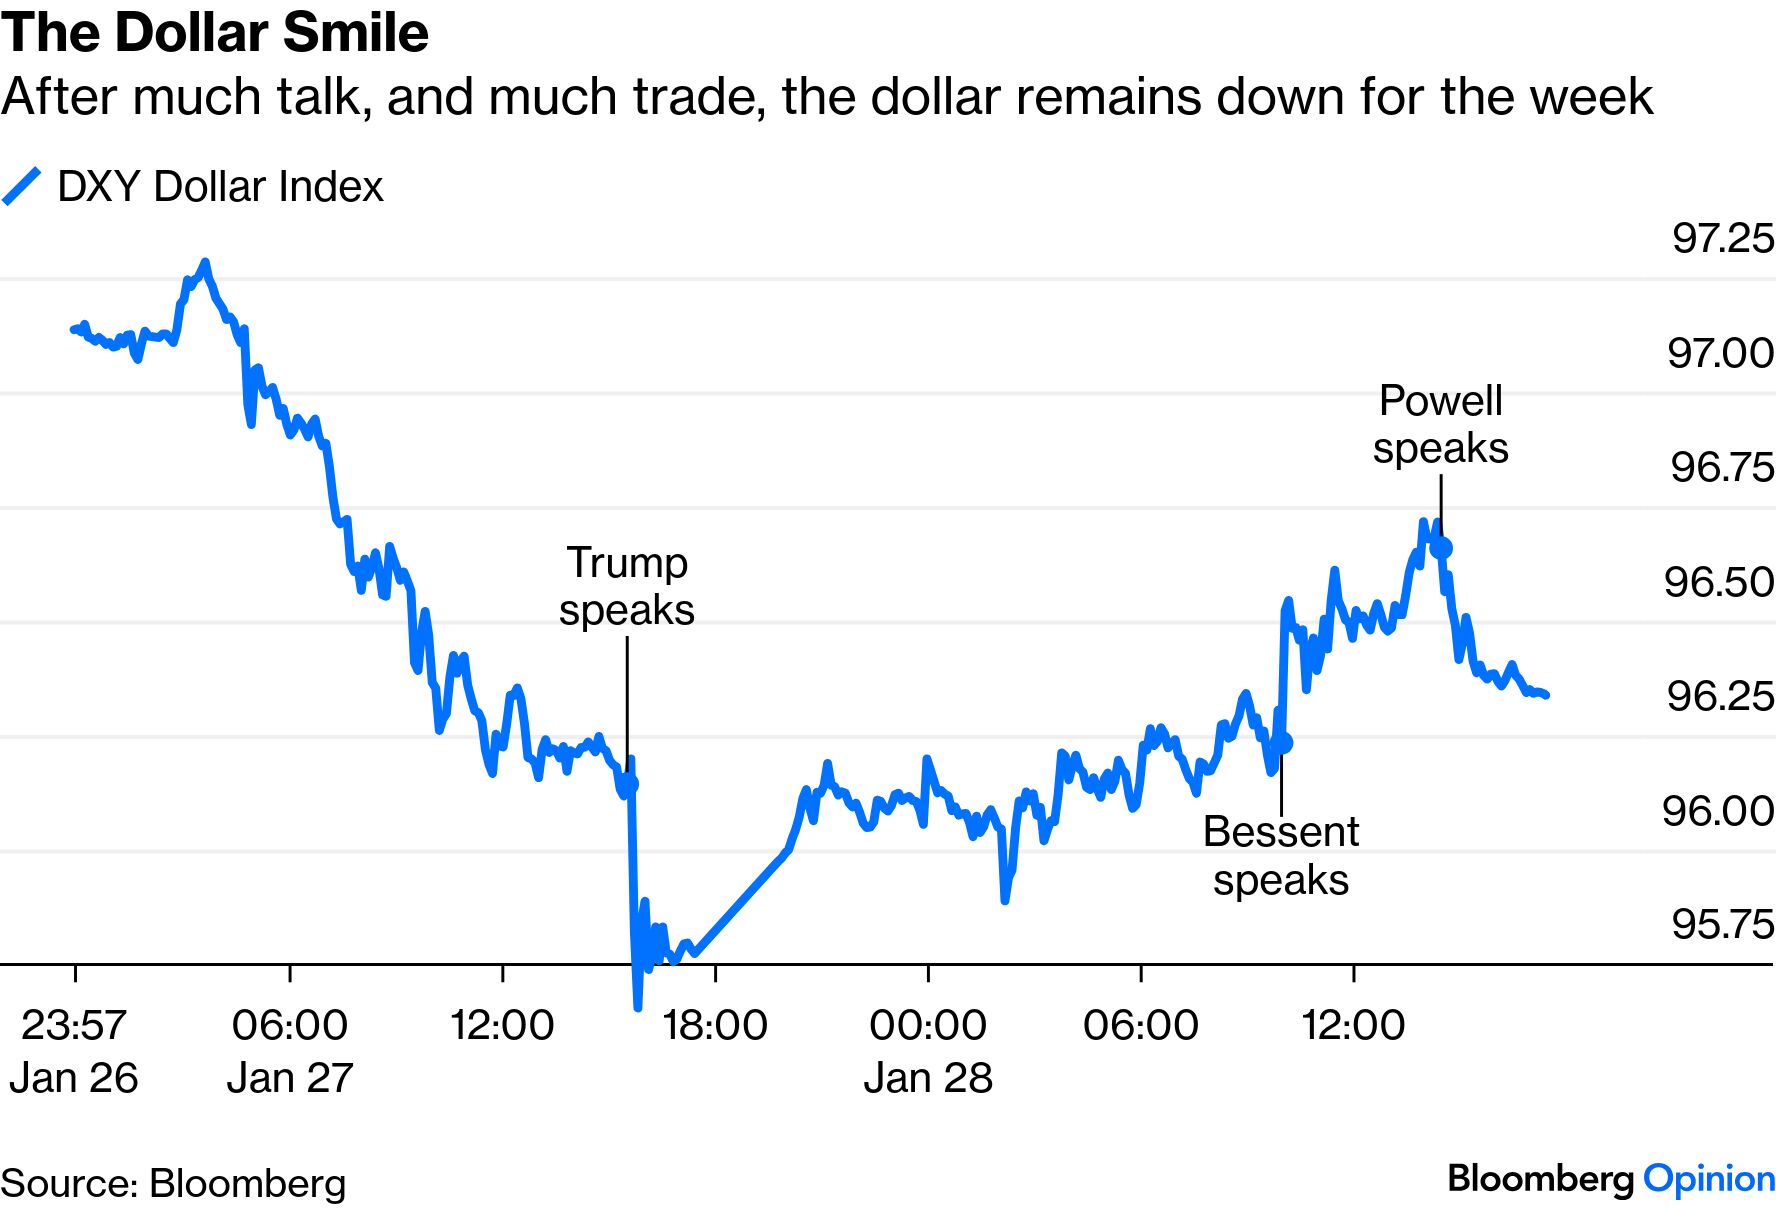
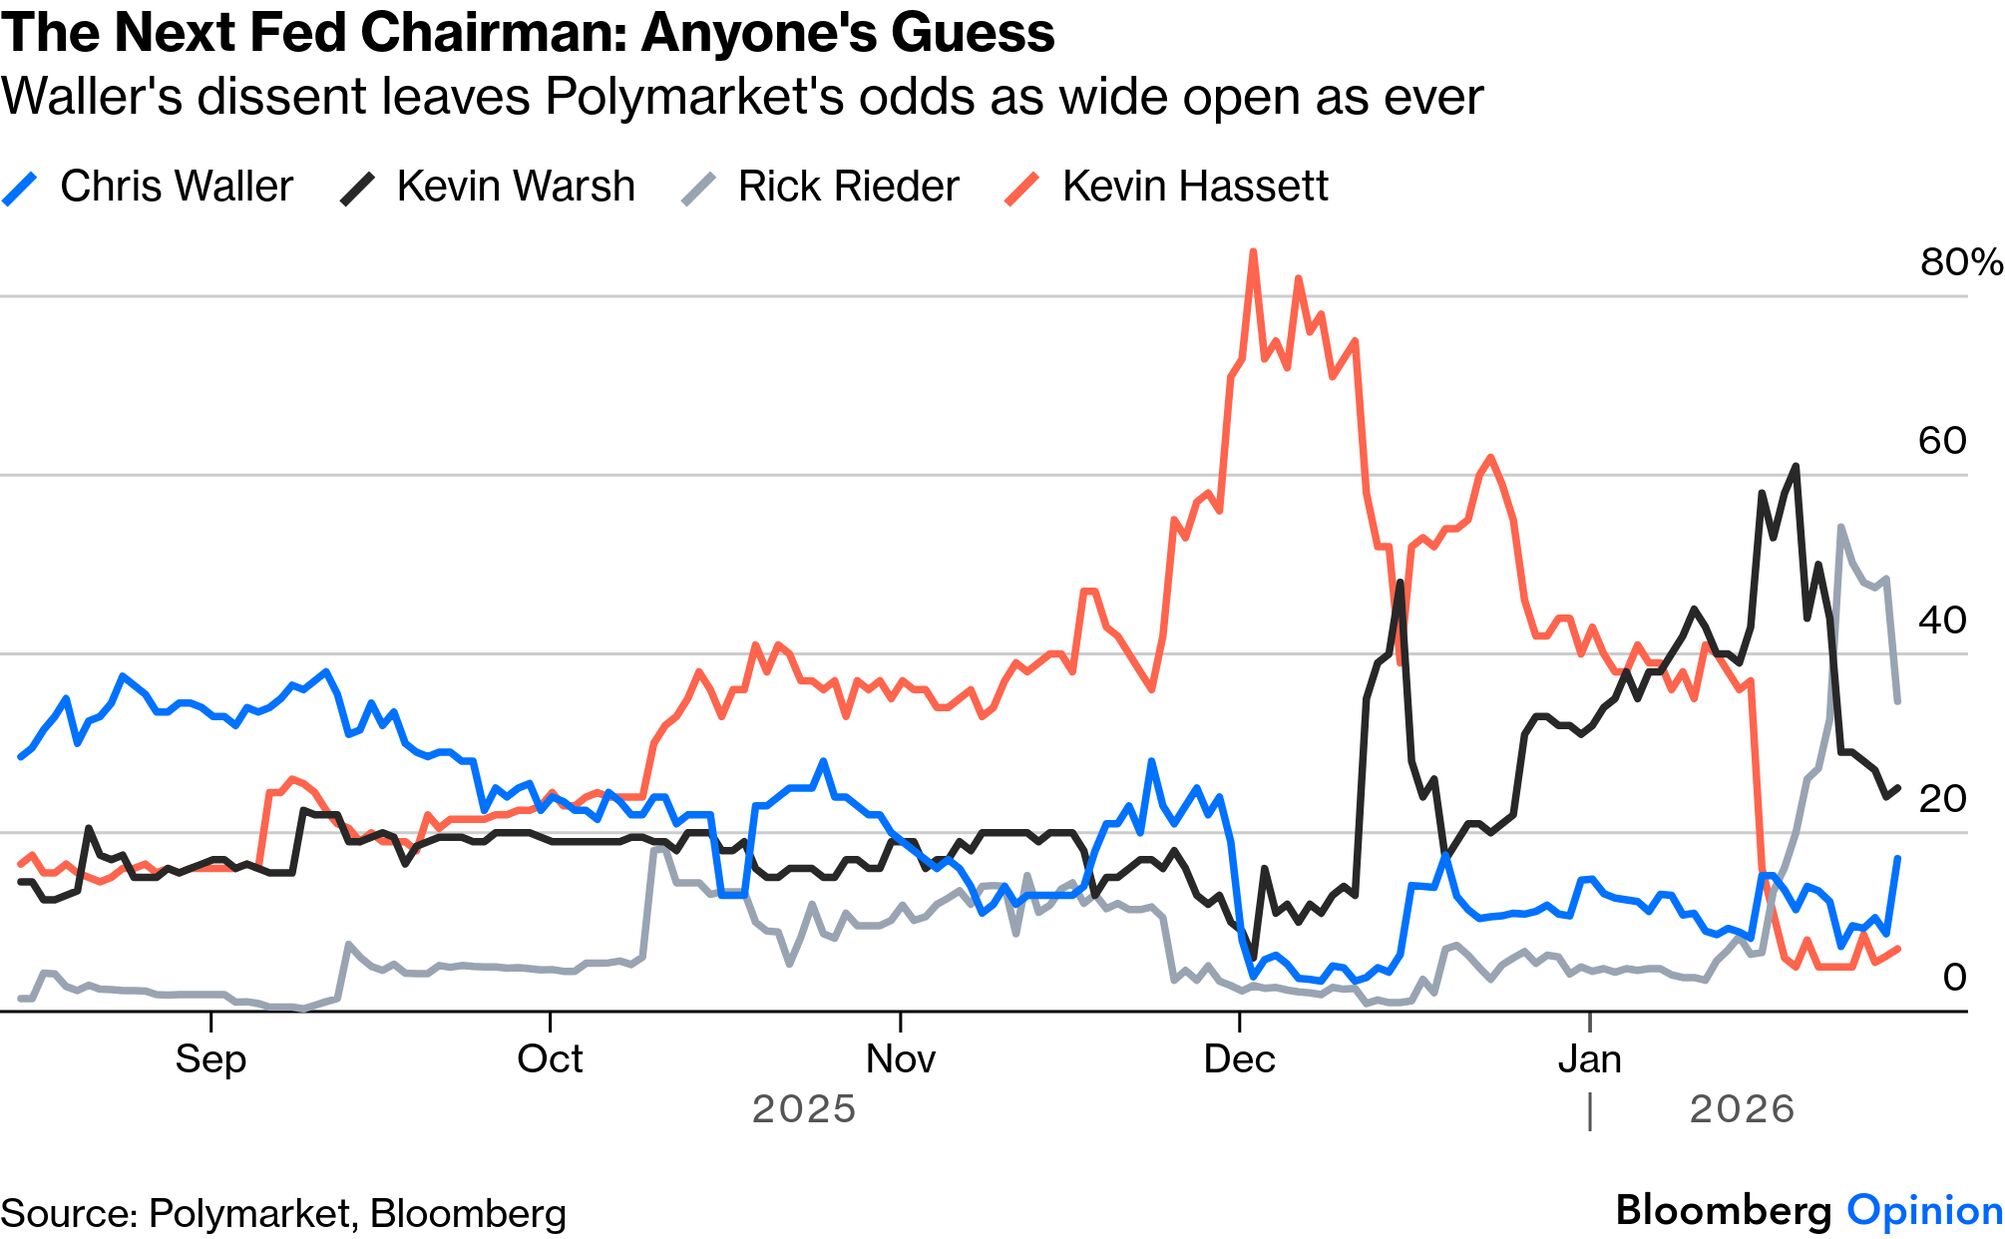
| It's a curse to live in interesting times. Central bankers have certainly learned that of late as the Federal Reserve and its governance have grown into a hot-button political issue. Generally, they want to keep things dull and predictable to minimize the risk of financial accidents. On that basis, Jerome Powell is probably happy with his day's work. In the midst of the greatest turmoil for the institution in decades, he and his colleagues on the Federal Open Market Committee conjured a truly uninteresting announcement on monetary policy. Rates are unchanged. There is no new steer as to the future. There are no new adjustments to the balance sheet. And there are no new projections or dot plots from the committee members. When Powell faced the press, he declined to answer a series of questions on the political issues at the top of everyone's minds. This is what happened to the main asset classes over the course of the trading day, with the moment of the FOMC decision marked with a vertical line. It would be hard to see that anything happened at that time without the marker: Rather than go into the normal drill for an FOMC day and explore the nuances with a fine-tooth comb, the main points of interest are: More Hawkish Than Dovish Powell left all options open, but his persistence in describing inflation as elevated, while sounding surprisingly confident about the employment market, marks him as tending slightly in the hawkish direction. As gold rose, while the dollar and 10-year yields fell in the late afternoon, the market didn't necessarily interpret him that way. He is wise to be non-committal as the tail risks in both directions are clear, and everyone can see them. Anecdotal evidence of big layoffs from companies as important as Amazon.com Inc. points to a more troubled labor market than the official data suggest. Powell drew attention to the Conference Board's survey, which indicated that consumers perceive the jobs market to be getting much tougher for them: Despite this, Powell describes policy at present as "loosely neutral." He thinks the cuts of the last three meetings have probably done the job. With the markets braced for a big fiscal boost and surging corporate profits, which might bring the risk of overheating, that's a reasonable position. The Dollar It was predictable that Powell would refuse to address the drama in the currency. It was less foreseeable that Scott Bessent, responsible for the dollar as Treasury secretary, would take as strong a line as he did. It was boilerplate to insist on CNBC that Washington "always has a strong dollar policy," but his emphatic denial that the US was "absolutely not" intervening to help the yen struck against a key reason for the recent run on the dollar. The switchbacks have been dramatic: By the end of the day, the dollar was almost exactly where it was when President Donald Trump described it as a yo-yo that could go up and down. The way that the Powell press conference was used as an excuse to sell some dollars again, along with the continued extraordinary ramp upward in the gold price, suggests that pressure on the currency will remain for now. Two Dissents This was interesting at two levels. First, Christopher Waller joined recent Trump appointee Stephen Miran in arguing for a 25-basis-point cut. Waller is a candidate to succeed Powell as chairman who dissented in favor of cutting last summer, but subsequently went along with the majority in a move seen at the time as denting his chances of the top job. Wednesday's dissent has been interpreted on prediction markets as re-injecting him into the mix, although he still lags former governor Kevin Warsh and BlackRock executive Rick Rieder in the betting: Five Concurrences Despite this vote, markets would view Waller as more prone to hawkishness in the future. More interesting than the dissents, however, were the votes in favor of holding rates. The Fed's 12 regional presidents provide five votes on the FOMC, with a new slate of five taking over each calendar year. We now have a clear sign that these five are happy to go along with Powell for now, and don't feel the need to make a statement with a dissent. This isn't a surprise, but it tends to confirm that moving the entire committee in a more dovish direction, an unabashed administration aim, will be very difficult. The chance of a big shift in Fed policy this year is, at the margin, further reduced. Powell's Future He gives up the chairmanship in May, but his term as a governor extends for two years after that. He could, if he wanted, continue to serve. Trump has made it clear that he wants him off the board altogether, which might well, in the current ugly environment, convince Powell that he should stay. He refused to be drawn on the question, which drew criticism from some. But the frankness with which he discussed a number of issues, and the way he ended the conference by asking "We done?" implied to amateur psychologists in the audience that he was in valedictory mode. Powell's comments on Fed independence, hotly disputed over the last year, read like the verdict of a man who has learned a lot on the subject. It's not at all a black-and-white issue. There are big issues with the Fed's governance, and any institution as powerful as a central bank must have some democratic accountability. But he articulated why it can't be left to politicians: The point of independence is not to protect policymakers or anything like that, it just is that every advanced democracy in the world has come around to this common practice. It's an institutional arrangement that has served the people well, and that is to not have direct elected official control over the setting of monetary policy. And the reason is that monetary policy can be used through an election cycle to affect the economy in a way that will be politically worthwhile.
It will be sad to see him leave. Powell led the Fed into a serious error in 2021, continuing to prime the economy with cheap money when inflation was taking off, but he has executed a surprisingly good save in the years since. He has conducted himself with dignity and intellectual honesty. This assessment from Dario Perkins of TS Lombard captures my feelings precisely: We are going to miss Jay Powell because – despite his flaws – at least his arguments are not completely intellectually intractable. Perhaps US monetary policy will get more exciting with a new chair, but that's not necessarily a good thing.
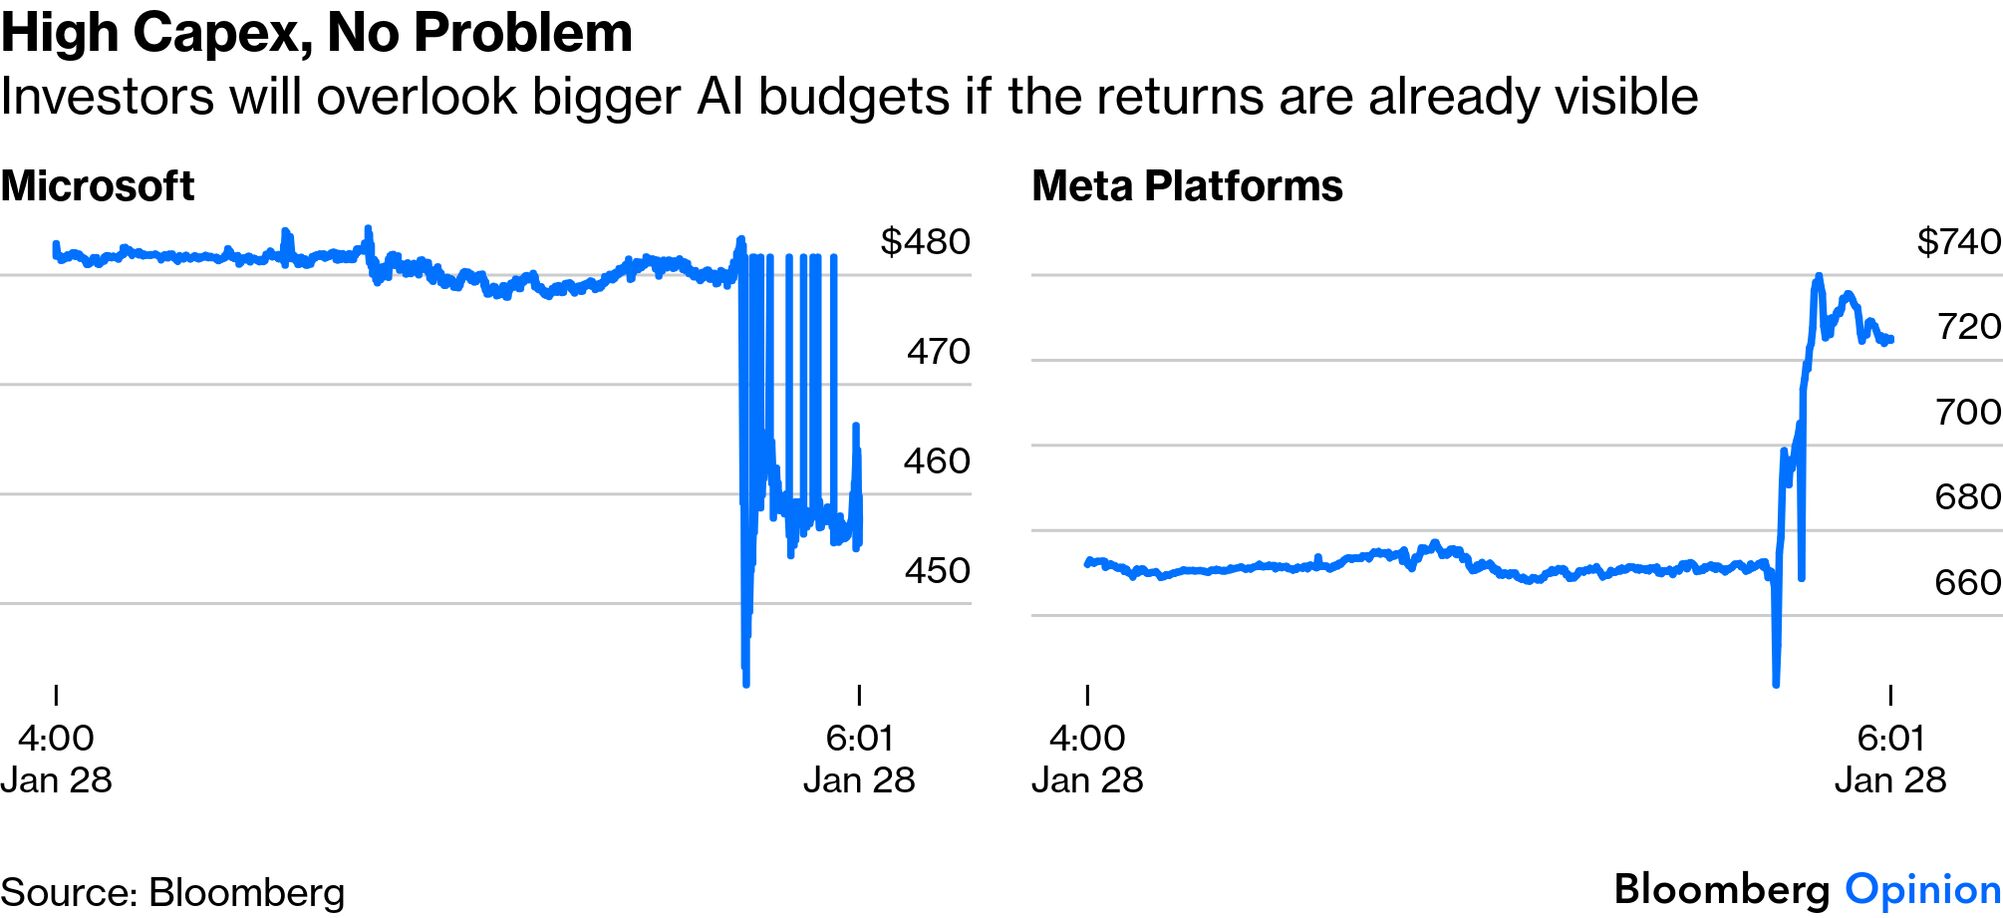
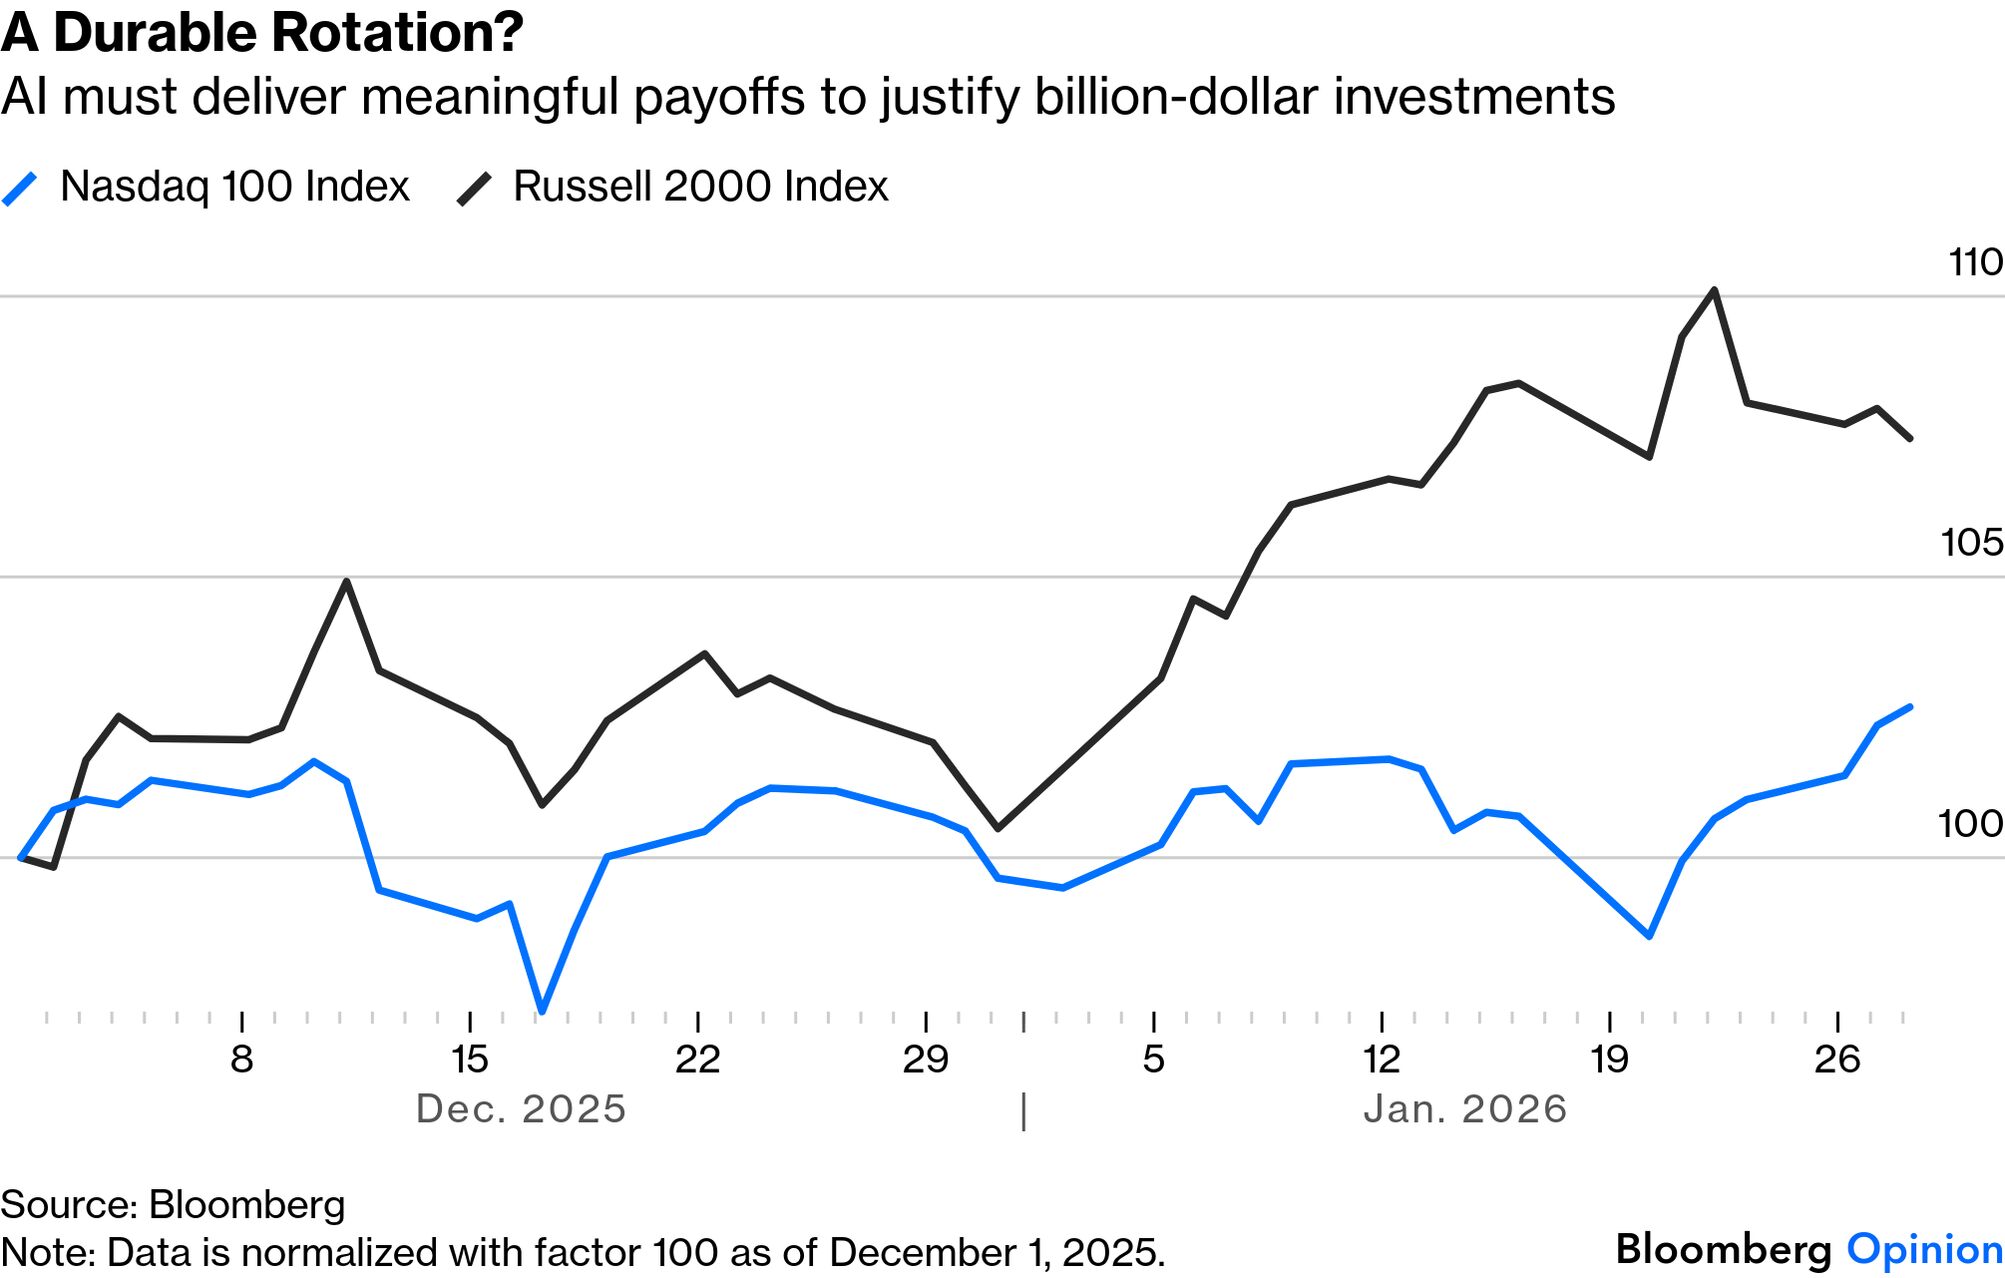
Investors are scouring the latest round of Big Tech earnings for validation of the vast investments in AI of the past few years. They have a familiar verdict. Results matter more than promises. Meta Platforms Inc.'s shares jumped about 10% in after-hours trading, driven more by its solid earnings beat than its commitment to ramp up already stupendous AI spending still further. The social media giant reported fourth-quarter sales of $59.9 billion, ahead of Wall Street's $58.4 billion consensus, buoyed by the strength of its advertising business and forecasting that first-quarter sales would be between $53.5 billion and $56.5 billion, above the average estimate of $51.3 billion. Microsoft Corp., by contrast, was punished for a slowdown in cloud computing growth, with shares sliding nearly 5% on the day. Capex surged more than 60% from a year earlier to $37.5 billion, ahead of analysts' estimates for about $36 billion — but that's unappealing if the company isn't delivering on the bottom line. The message from markets is straightforward: Investors will tolerate rising capex, but only when there is tangible evidence that earlier bets are paying off in a meaningful way. This is how the two mega caps fared in extended trading: The reaction to Tesla, which also reported, was less dramatic. Elon Musk's flagship company earlier this month said that deliveries dropped 9% last year compared to 2024. That slump sharpened in the fourth quarter, when they dropped 16%. Still, the company's profit exceeded expectation, snapping a string of quarters in which it missed. So far, almost half of the Bloomberg Magnificent Seven have reported, with results that roughly cancel each other out. The broader question is whether AI can muster enough firepower to halt the rotation away from the tech behemoths that has gathered pace since they last reported. The rotation is clear from the divergence between the Nasdaq 100 and Russell 2000 in the last two months: Whether that rotation continues will depend on earnings elsewhere. BNY's Bob Savage notes that stronger profit growth from already over-owned sectors such as materials, transportation, energy and real estate would give the shift greater staying power. For investors looking for winners, he adds that factor dynamics — particularly value and size — tend to be decisive during rotations. As shown by this chart from Confluence Technologies of the relative exposures to the different investment factors, there is value to be found in most places away from tech:  Source: Confluence Technologies The problem, Savage says, could be political rather than economic: White House efforts to accelerate US growth while containing inflation will leave little room to raise profit margins, particularly for businesses that sell directly to consumers. This rotation, of course, is far from a done deal. Barclays analysts, including Alexander Altmann, argue that still-loose financial conditions (even if the Fed has stopped cutting) suggest riskier assets could continue to outperform. And the models run by Chris Watling of Longview Economics point to further upside for US equities over the medium term. Investor sentiment has improved, Watling says, but isn't yet exuberant. Microsoft's difficult reception in after-hours trading does however suggest that investors grasp that they have other options. The bar for exiting the biggest names seems to have been lowered. — Richard Abbey |